Showing posts with label Arsenic. Show all posts

Sunday, August 9, 2015

Oops! EPA Accidentally Pollutes the Animas River

Edit: March 18, 2016: BOI Report on the incident. 

Rivers are not supposed to look like this.

Source
Update video on the spill.

For those readers who may be looking at the news, and the recently posted lab data, maybe I can help make some sense out of those numbers.

I am a public health guy.  I love fish and plants as much as anyone else, but I really don't deal with aquatic toxicity.  So looking at the lab results, I see a lot of "metals" that are not the toxic metals to human health I deal with,

By the way...Ignore all the letters by the results.  Those are important, but, for all intents and purposes, the values reported are the values we can assume were actually present at the time the sample was taken.  D, for example means they had to dilute the sample to get it low enough for the instrument to read it without overloading it.  Too much and the instrument's reading goes off the scale, so you dilute it, and then take the result and estimate how much is in there.  There is error put into that result when it is denoted with a "D", but again, these results are so high that potential error is meaningless.

Let's look at sodium for example.  The lab reports a maximum concentration of 11,100 ug/L at the the 32nd St Bridge.

That's 1,110 parts per million, ug/L is ppb, there are 1000 ppb in one ppm.

So I asked myself, 'what is the normal sodium concentration found in freshwater streams?'

Good ol' Google...Sodium looks to be about 5 ppm as a high concentration.  So the sodium is elevated for sure, but less than sea water (10,500 ppm).

Now let's look at the human health concerns.  Assuming there is no cyanide, the primary concern for this water coming from a mine is the heavy metals, and for those, I want to look at just what we call the "RCRA 8."

Looking at the analytical results, it looks like only lead is a really big concern - human health wise.

Source
Let's look at two of the metals.  The others are important, but these two have the highest concentrations and are a bigger deal toxicity wise.

Arsenic looks to be about 1080 at the highest concentration found.  As you can see above, the MCL - U.S. EPA's drinking water standard - is 10 ug/L.  Now remember, that's for drinking the water.  And not just drinking it once, but drinking two liters per day, almost every day, for 70 years.  Drinking a glass of this water would not, based on the lab results shown, be a concern (it would probably taste terrible though).  Potable and Palatable!

Lead...on the other hand...well...

25,600 ug/L at sample location "A72."

The MCL for lead is 15 ug/L

That's 25 ppm of lead in that sample.  See the TCLP results above for lead?  5 mg/L or 5 ppm..

That water, from location A72,  meets the definition of a hazardous waste,  Not that that makes it "toxic", it just shows that the concentration of lead is pretty gosh darn high.

So...dilution will be the solution to pollution here, but this river was heavily contaminated by some toxic stuff, that should have never gotten into this river (call me Captain Obvious).

It will be interesting to see what takes place to the environment as this water makes its way downstream.

Time will tell.

Saturday, January 4, 2014

If they only had a RCRA permit...Part 7

Does Exide pose an imminent or substantial risk to the community?

The DTSC ordered Exide to cease operation on April 24, 2013 claiming that:
16.1 In a letter dated March 1,2013, the SCAQMD advised Exide that the HRA submitted by Exide in January, 2013 indicates the Facility poses a maximum individual cancer risk (MICR) of 156 in one million for an offsite worker receptor about 300 meters northeast of the Facility (primarily arsenic).
In addition to compromised stormwater piping that Exide self-reported, the HRA values for cancer and non-cancer risk were also used by the DTSC to claim the need immediately shut down operations on the grounds that these two situations met the 25186.2 conditions for DTSC action "necessary to prevent or mitigate an imminent and substantial danger to the public health or safety or the environment."

Assuming that fixing the stormwater pipes corrects and mitigates that issue, does Exide pose a "maximum individual cancer risk" now or at the time of the DTSC notice to cease?

Looking at Exide's HRA:


You will notice that arsenic is the primary contributor to the risk number that was quantified.  In the RRP, Exide states:
Analysis of the HRA results and concurrent research determined that approximately 90 percent of the above-tabulated risks were due to emissions of arsenic from the Hard Lead Ventilation System stack and that the source of that arsenic was the “leakage” of blast furnace process exhaust from its primary ventilation system into hooding served by the Hard Lead Ventilation System.
So if both Exide and the DTSC conclude that arsenic is the chemical of concern for the risk, eliminating or reducing the amount of arsenic put into the air would reduce that risk.  Exide made some modifications to their equipment and went back into the original numbers and recalculated the theoretical risk:
Promptly after AQMD approval of the HRA on March 1, 2013, Exide designed an isolation door on the charge chute to the facility’s blast furnace to minimize the potential for blast furnace process exhaust gases to be drawn into the hooding served by the Hard Lead Ventilation System. This door system was permitted on March 28, 2013, and became operational on April 4, 2013. This door remains closed except to open briefly when charge material is actually being added to the furnace, only a small percentage of the time. (1)
What if instead of calculating a theoretical risk we could agree on something a little bit more quantitative and easier to understand.  Let's makes some assumptions and hold them as true.
  1. Exide should only be held accountable for the risk they pose over background.  That is, if you take Exide out of the equation and there is no difference in the amount of arsenic in the air, then the same risk is still present.  Exide is responsible for what they put in over that baseline.
  2. We will assume that the cancer potency the SCAQMD used for arsenic calculates a risk of 16 in one million for one nanogram per cubic meter of air.
  3. We will assume that the data collected by SCAQMD and reported in this document accurately reflects the actual amount of arsenic in the air near the Exide Vernon facility.
  4. We will assume that April 4, 2013 the facility was in operation with the new controls put in place and on April 24, 2013 operations ceased.
  5. We will assume that "the last week of June" is the 24th of June to indicate when Exide resumed operations.
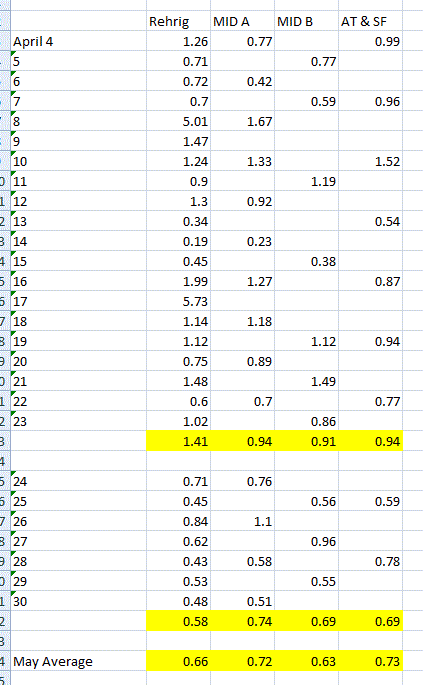
What I am going to do is calculate the average arsenic concentrations for each of the monitors based on the data presented in the SCAQMD document.  I am going to do this for the following periods:
  • April 4 to April 23 (new controls in place)
  • April 24 to June 23 (Exide not in operation - background)
  • June 24 to September 30th (Exide in operation last date for data provided)
I'll attach at the bottom of this post a gif of the spreadsheet I used to show the numbers that went into calculating these three time frames.  Here is what I came up with:


Based on where these monitors are placed...:

SCAQMD

According to SCAQMD's graph:

Source
The SCAQMD states that an average concentration of 1 nanogram per cubic meter equates to a lifetime cancer risk of 16.6 additional cancers.  I am not sure how they calculated that risk because it does not seem to jive with their written methodology for calculating cancer risk.

Based on California's 2003 "Air Toxics Hot Spots Program Risk Assessment Guidelines" the formula for calculating excess cancer risk look like this:

Appendix I - 4
The Inhalation Dose is based on this formula:

Appendix I - 2
Using their arsenic example for calculating the dose...:

Appendix I - 3

...I replaced 0,0015 micrograms with 0.0001 micrograms (1 nanogram).  The inhalation dose, based on 1 ng/m3 equals 3.8 x 10⁻⁸ mg/kg-day

To calculate the cancer risk per million, I replaced the Inhalation dose in the following example with the one calculated based on 1 ng/m3:

Appendix I-4
Based on an exposure of 1 ng/m3 the inhalation cancer risk is 0.45 chances per million.  That number is consistent with the cancer risk calculated by the WHO (0.66). [Cancer Potency checked 2011 most current]

So what does all this mean?

The DTSC gave an immediate cease operation order to Exide based on "imminent and substantial" harm to the public, claiming that:
Based on the Health Risk Assessment submitted to the SCAOMD, DTSC has determined that the Facility is operating its furnaces and its air pollution devices in a manner that is not sufficiently protective of human health and the environment, impacting as many as 110,000 residents in a large geographical area...
The HRA is a theoretical exposure calculated by Exide.  The graph SCAQMD put together represents actual concentrations of arsenic in the air. Before the order to cease operations was given by DTSC the SCAQMD had been collecting arsenic concentrations in the air in and around the Exide facility.

The SCAQMD calculated the highest monthly average of 3.33 ng/m3 from the off-site ATSF in May of 2012.  Assuming that all of that arsenic came from Exide - less the background I calculated (0.75) - this would give us a concentration of 2.58 ng/m3.

2.58 ng/m3 exposure equals a dose of 9.7 x 10⁻⁷.  With that dose, using the California HotSpot calculations, the excess cancer risk would be 11.67 in one million.

Would the highest amount calculated - before the modifications were made - be considered "imminent and substantial"?  That depends on how those two terms are defined.  Here is what the SCAQMD defines as "significant" in their Rule 1402:


Under the rule for air emissions, a cancer risk of 11.67 per one million would equal a risk of 0.11 per one hundred million and would not be considered "significant."

All of this information was available to the DTSC.  Heck if I can find it just using Google and a team of me, myself, and I, so could the DTSC.


Next Post: If they only had a RCRA permit...Part 8


__________________________


Thursday, January 2, 2014

If they only had a RCRA permit...Part 6

April 24, 2013:
A separate report submitted to the South Coast Air Quality Management District by Exide demonstrates that emissions from the facility operations pose a significant risk to the surrounding community.
That's the reason DTSC gave for telling Exide to "CEASE OPERATIONS EFFECTIVE APRIL 24, 2013."

That report, called a "Health Risk Assessment" was required by the SCAQMD and approved by them on March 1, 2013.  The next step was for Exide to make a public notice and develop a Risk Reduction Plan (RRP) which they did on August 28, 2013.

The DTSC, with the data from the HRA - along with the stormwater pipe issues - struck Exide with a cease operations mandate, which Exide challenged and won, starting operations back up on the last week of June, 2013.

That's a nice little history lesson you might be thinking, but what does it have to do with anything?

My question, at this point in time, regards harm or risk to the community around the Exide facility in Vernon.  The public wants it shut down and they are concerned for their health, as the Los Angeles Times wrote October 8, 2013:
Joe Gonzalez of Boyle Heights demanded of regulators: "How dare you come back here and ask us what we want. You're killing us...at what point does this become blatant racism?"
De León, who called the meeting, noted that "there are no Exides in Brentwood ... in Malibu."
"Are our children worth as much as any other child?"
 Does Exide present a "significant risk to the surrounding community."?

Well, I guess that would depend on how one defines the term "significant."

Here is how the SCAQMD defines it:

Rule 1402
What's a MICR?

Rule 1402
What did the DTSC find in the HRA that indicated a "significant risk level?"

Source

Based on the data from the HRA, Exide presents a "significant risk level" for workers but not for the folks who live in the area.

The problem with those numbers; 156 in one million and 22 in one million, is that they are theoretical and based on a model.  Here is what the formula looks like:

Rule 1402


The MICR that is calculated is an estimate based on the premise that the receptor will be exposed to the maximum emission rate every day for a particular length of time (70 years for a residence).  All of this predicated on a calculated annual average concentration for all the chemicals emitted.  Those numbers are then multiplied by this thing they call in California the "Cancer Potency."

Cancer Potency, or the Slope Factor is how we determine that one in a million risk.  I written about it a lot in previous posts.  It assumes a straight line dose-response where no exposure = no cancer and any exposure = risk of cancer.  Remember that SCAQMD graph on arsenic in and around the Exide facility?

Source
Look at the sentence at the bottom.  The cancer potency derived from the slope of the line calculates 16.6 additional lung cancers per million for one nanogram of arsenic in one cubic meter of air inhaled everyday for 70 years.

Let me remind you how small a nanogram is.
  • 1 milligram = 0.001 grams
  • 1 microgram = 0.000001 grams
  • 1 nonogram = 0.000000001 grams
I was curious to how that number was derived.  So I went to the Google and found a document from the World Health Organization (WHO) Regional Office for Europe, Copenhagen, Denmark.
Neutron activation analysis (NAA) has a detection limit of 0.1 ng for total arsenic
Okay, I was wondering how they can detect with any degree of confidence to the nanogram level.

Then I read this in the WHO document:


WHO

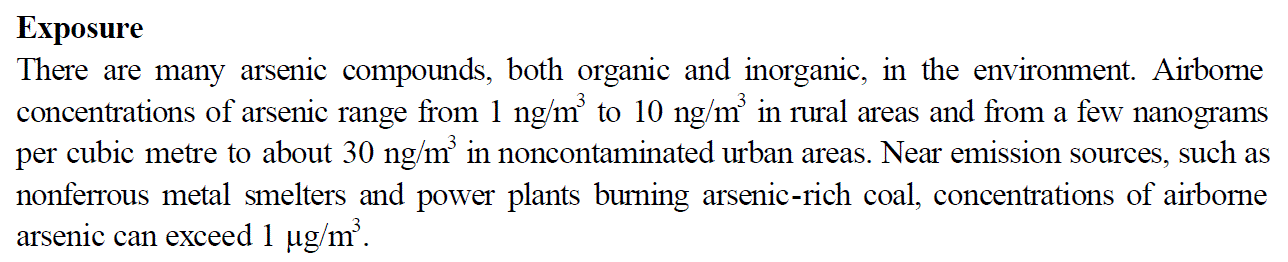
Wait...if the breathing rate is 20 cubic meters a day, and the estimated lower end is 20 ng, that would mean in a rural area the average amount of arsenic in air is about 1 nanogram per cubic meter.  The SCAQMD graph shows the average arsenic in the SCAQMD area to be just above 0.5 nanograms.  I thought that seemed low when I first saw the graph, but now it does not jive with what the WHO states should be found in industrial areas.

But I digress.  Back to slope factors:

WHO
Okay, that's a bunch of words.  What does it all mean?

WHO

The WHO estimates about 2 additional cancers per nanogram while the SCAQMD estimates 16 per nanogram.  That's how this process of looking at cancer risk works.  It's kind-of-sort-of quantitative but how accurate it is in actually determining the real risk is anyone's guess.  So what ever model they use, or data they depend on, once accepted becomes the way it is calculated.  They hope it reflects reality, but really what they want is the most protective model they can "scientifically" support.  The WHO supports 0.66 ng/m3 for a one in one million risk while California supports about 0.06 ng/m3 for the same risk.  Which one is correct?

As I have said before, this is how we do it, this is all we got, so...if you can support your slope factor then I will need to accept your estimated cancer risk.

The problem I have with this as it relates to Exide is that the DTSC used this calculated risk to meet the definition of "significant" which they then used as the reason to tell Exide to cease operation.

That's not what the estimate of risk calculated in the HRA was to be used for, and somebody at the DTSC should have known that.

Those values calculated by Exide and reported in the HRA are used to determine where effort needs to be placed in terms of controls.  This is done through the submission of a Risk Reduction Plan (RRP)

DTSC used those numbers claiming that they required the operation cease to "prevent or mitigate the substantial danger pursuant to Health and Safety Code Section 25186.2."
25186.2.  The department may temporarily suspend any permit, registration or certificate issued pursuant to this chapter prior to any hearing if the department determines that the action is necessary to prevent or mitigate an imminent and substantial danger to the public health or safety or the environment.
I went looking for California's definition of "imminent" in the Health & Safety Code
113810.  "Imminent health hazard" means a significant threat or danger to health that is considered to exist when there is evidence sufficient to show that a product, practice, circumstance, or event creates a situation that can cause food infection, food intoxication, disease transmission, vermin infestation, or hazardous condition that requires immediate correction or cessation of operation to prevent injury, illness, or death.
I went looking for the definition of "substantial" in California and this is what I found:
A substantial factor in causing harm is a factor that a reasonable person would consider to have contributed to the harm. It must be more than a remote or trivial factor. It does not have to be the only cause of the harm.
Okay, so you get the picture.  I think DTSC misused the information in the HRA - theoretical risk - to claim actual risk.  Apparently so did a Judge and Exide was up and running the last week of June 2013.

Remember that graph from the SCAQMD?  They included the data along with the graph.

Back to my question.  Does Exide pose a significant or substantial risk to the community?  Or, looking at it another way, would the community see their health positively impacted if Exide were closed?

Next Post:  If they only had a RCRA permit...Part 7

.

Wednesday, January 1, 2014

If they only had a RCRA permit...Part 5

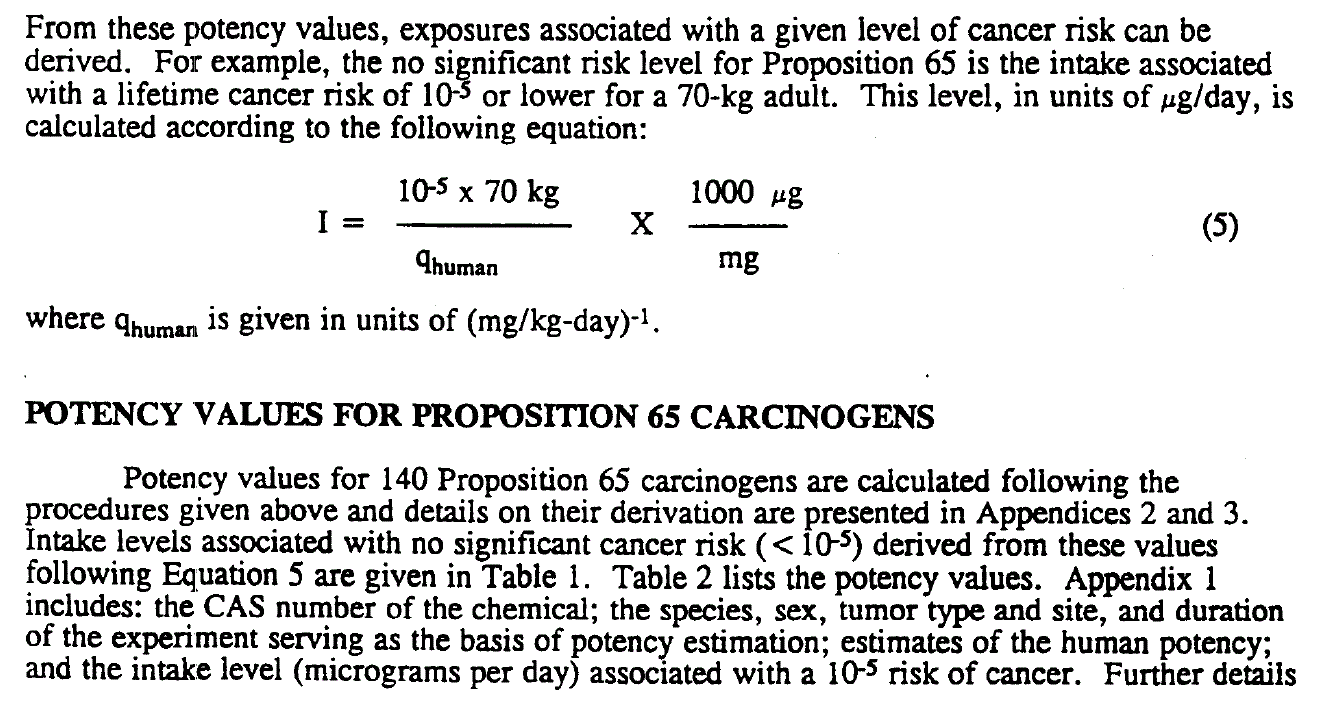
So the DTSC tells us in Exhibit 2 that they accept "a cumulative risk that does not exceed a one in one million (10-6) for cancer risk."

That did not sit right with me.  I wrote about California and how it calculates the slope factor for carcinogens and how it applies to the Proposition 65 notification requirements.  So I went about looking for that document.  And I found it:

Page 3
So DTSC accepts a 10-6 cumulative risk except when they accept a 10-5 cancer risk. This is one of the main problems in establishing risk.  Sometimes one in a million is okay, sometimes one in ten thousand is acceptable.

Okay, okay, I know what you are thinking.  The SCAQMD found a residential cancer risk of 22 in one million to the nearest residential receptor.  That's a 2.2 to the 10-5 risk and that's over one in 100,000.

Yeah, okay, that creates an increase risk - theoretical mind you - but a risk.  Not sure that 2.2 x 10⁻⁵ constitutes "an imminent and substantial danger to the public health or safety or the environment" though, even if you include the leaky stormwater pipes.

My question is, at this point in the discussion, does the arsenic emitted from Exide put the community at an imminent and substantial danger?  Remember our three intrepid reports at the Los Angeles Times?  Here is what they wrote about this risk:
In March, the South Coast Air Quality Management District reported that arsenic emissions from the plant created an elevated risk of cancer for as many as 110,000 people in an area stretching from Boyle Heights to Huntington Park.
I wonder where they got that number?  Oh, that's what the DTSC claims in Exhibit 2 of their justification to order Exide to halt operations:
18. Based on the Health Risk Assessment submitted to the SCAOMD, DTSC has determined that the Facility is operating its furnaces and its air pollution devices in a manner that is not sufficiently protective of human health and the environment, impacting as many as 110,000 residents in a large geographical area that includes portions of Vernon, Maywood, Huntington Park, Commerce, Boyle Heights and unincorporated areas of east Los Angeles. The predominant contributor to both chronic and acute cancer risk and non-cancer hazard is arsenic emissions from the Facility, with the primary human organs that are harmed are the cardiovascular system, central nervous system, developmental system, respiratory system and skin.
What this tells me is that the Exide facility in Vernon, California is pumping into the air enough arsenic to harm 110,000 people, causing cancer and affecting their cardiovascular system, central nervous system, developmental system, respiratory system and skin!

So...what did the SCAQMD find regarding arsenic and Exide?  Let's look at this graphic first:

Page 2 of the report
Before I get into the details of what is going on, I want you to look closely at this graphic paying particular attention to the "y" axis.  Do this while repeating "and non-cancer hazard is arsenic emissions from the Facility, with the primary human organs that are harmed are [sic] the cardiovascular system, central nervous system, developmental system, respiratory system and skin."

If you have read any of my other posts you will understand why this one bugs me.  Do you see how much arsenic was detected in the air around the facility?  Not milligrams (1,000th of a gram), not micrograms (1,000,000th of a gram) but nanograms - 1,000,000,000th of a gram.

Yeppers, that's what we now look at for arsenic in the air.  Nanograms per cubic meter.  So my next question will be, does less than 3.5 nanogram per cubic meter (the highest amount shown on the graph) present an "imminent and substantial danger?"

Remember those loud and angry folks yelling “Shut it down! Shut it down!”?  Those folks look to the DTSC for an answer.  They look to us scientists, toxicologists, experts for an answer to their number one concern "are we being harmed?"  And the DTSC gives them this:

Based on an average of about 2 nanograms of arsenic in each cubic meter of air, Exide is impacting "as many as 110,000 residents."  And "the predominant contributor to both chronic and acute cancer risk and non-cancer hazard is arsenic emissions from the Facility, with the primary human organs that are harmed are the cardiovascular system, central nervous system, developmental system, respiratory system and skin."

Is that an accurate representation of the risk these residence are encountering?


If they only had a RCRA permit...Part 6

.

Sunday, August 4, 2013

The source of elevated constituents is speculative, but... - Part 8

Okay, so the yellow dots they used in the graphic really got me thinking that this paper, "An evaluation of water quality in private drinking water wells near natural gas extraction sites in the Barnett Shale Formation" they talked about on the UT Arlington webpage might be a bit slanted against natural gas extraction.


I read their paper with a somewhat open mind to see the "powerful evidence" they had that further study was required because, as the website points out:
Researchers believe the increased presence of metals could be due to a variety of factors including: industrial accidents such as faulty gas well casings; mechanical vibrations from natural gas drilling activity disturbing particles in neglected water well equipment; or the lowering of water tables through drought or the removal of water used for the hydraulic fracturing process.  Any of these scenarios could release dangerous compounds into shallow groundwater.
You will notice that with the exception of drought (which we in Texas have been experiencing) all of the factors they list as the possible culprit for this increase in metals (arsenic) involve natural gas extraction.

They make their case two ways.  First, they sampled groundwater in the Barnett Shale area and ran it for chemicals one would expect to see coming for this type of activity.  Second, they compared the results to what we knew the levels of those contaminants to be prior to gas extraction activities commencing in the area.

The idea here is to show that the groundwater post 1999 is more contaminated then pre-natural gas extraction groundwater samples.

They were able to do this for only arsenic and TDS (although they make a case for the other metals being elevated as well).  Based on this comparison of the ground water now, with the groundwater pre-2000, they present "plausible scenarios" to explain why the metals are elevated, concluding:
At a minimum, these data suggest that private wells located near natural gas wells may be at higher risk for elevated levels of constituents than those located further from natural gas wells.
This before and after is based on:
This comparison shows a significant increase in the mean concentration, maximum detected concentration, and MCL exceedances for As, Se, and Sr in our study area when compared to historical data and previous characterizations of these aquifers.
Like I pointed out in my last post, it is this comparison that forms their conclusion.  So skeptical me asked what the comparison would be if you looked at the pre-2000 historical data and compared it with the post-1999 historical data. So I did.

Running a query on the same dataset they used in the report, I looked at the post-1999 results for arsenic in the groundwater wells in the four counties the Railroad Commission calls "Core Counties."  Wise, Johnson, Denton, and Tarrant are in the heart of all the natural gas wells in the Barnett Shale area.  If there is going to be arsenic contamination due to any of the factors listed in the UTA website, it will show up here.

My query of the dataset showed 170 water samples were analyzed for arsenic after 1999.  Of 170 analytical samples for arsenic, as recently as 2011, only two show any arsenic above >2 ppb.  5.93 ppb and 2.93 ppb.

These 170 analytical reports for arsenic from 48 unique wells within these four core counties.  None of them show the concentration of arsenic reported in the paper.  All of them are in the same geographic area where active natural gas wells are located.

What about the counties of Palo Pinto and Jack where there is only red and yellow dots shown on the graphic?  Not a lot of data for these two counties.  Pre and post is all under 10 ppb.


Not enough data to show a comparison.

So where does this leave me?  My take away is that there is no connection between gas extraction and metals in the groundwater.  Here is why:
  1. The absence of BTEX in all the wells UTA sampled rules out "industrial accidents" and "faulty gas well casings" as the cause for an increase in arsenic.
  2. The absence of arsenic in the historical wells post 1999 rules out "the lowering of water tables through drought or the removal of water used for the hydraulic fracturing process."
Still, I am faced with the fact that they did find arsenic above the 10 ppb MCL in about a third of the wells they tested.  Why?  This leaves only one possible factor in play:
Mechanical vibrations from natural gas drilling activity disturbing particles in neglected water well equipment
There are a number of issues in play here before I can accept that "plausible factor":
  1. Does a neglected well release arsenic due to mechanical vibrations in the area?
  2. Why is there arsenic in some wells in the same aquifer and not in others from the same aquifer in the same geographic area?
  3. Did the sampling, preservation, and analytical method UTA used bias the results to show a positive result for arsenic?
Here is what I would want to see done first:
  1. Re-sample the wells that were positive for arsenic above the MCL utilizing the same protocol used to collect the water samples for the historical data.
  2. Analyze those water samples using EPA method 200.8
  3. Have the analysis performed by a NELAC accredited laboratory
Doing this would rule out any errors produced by UTA and would allow us to apples with apples compare the arsenic data from the private wells with the arsenic data from the historic wells.  This, in my opinion, would help show a true value of arsenic that we can relate to an MCL and support looking at mechanical vibrations as the culprit if there are a number of wells that actually exceed the MCL

If you got this far, thanks for reading.

.

Saturday, August 3, 2013

The source of elevated constituents is speculative, but... - Part 7

The UT Arlington webpage describing the study titled "An evaluation of water quality in private drinking water wells near natural gas extraction sites in the Barnett Shale Formation" states this:
Researchers gathered samples from private water wells of varying depth within a 13 county area in or near the Barnett Shale in North Texas over four months in the summer and fall of 2011. Ninety-one samples were drawn from what they termed “active extraction areas,” or areas that had one or more gas wells within a five kilometer radius.
They compared the samples to historical data on water wells in these counties from the Texas Water Development Board groundwater database for 1989-1999, prior to the proliferation of natural gas drilling.
The website states this as one of the results of the study:
Arsenic occurs naturally in the region’s water and was detected in 99 of the 100 samples. But, the concentrations of arsenic were significantly higher in the active extraction areas compared to non-extraction areas and historical data.
The paper states this:
The United States Geological Survey (USGS) sampled arsenic as well as pesticides, nitrates, and volatile organic compounds (VOCs) in drinking water wells, including wells from aquifers overlying the Barnett Shale formation. Using these data and other data from the Texas Water Development Board, Reedy et al. characterized groundwater in the Trinity and Woodbine aquifers as generally good quality with very few exceedances for constituents such as arsenic, selenium, strontium, and barium.
So we have good groundwater to start with.  The paper states that they collected samples and performed analytical tests for certain chemicals of concern.  Then they write:
These data were compared to a historical dataset from the same aquifers prior to the expansion of natural gas extraction activities
And now we have a before and after to make some type of inference.
While our data indicate elevated levels of potentially harmful compounds in private water wells located near natural gas wells, it is important to recognize that there were also a number of private water wells in close proximity to natural gas wells that showed no elevated constituents.
Okay...
This indicates that natural gas extraction activities do not result in systematic contamination of groundwater.
If it did, we would expect to see contaminants in all the wells.  Fair enough.  I concur (for whatever that's worth). So, what's going on?
We suggest that episodic contamination of private water wells could be due to a variety of natural and anthropogenic factors such as the mobilization of naturally occurring constituents into private wells through mechanical disturbances caused by intense drilling activity, reduction of the water table from drought or groundwater withdrawals, and faulty drilling equipment and well casings.
There's that "sandwich effect" I talked about in Part 2.  But wait, there's more...
The geographic locations of elevated constituent levels in our study are consistent with the notion that mechanical disturbance of private water wells and industrial accidents (e.g. equipment failure, faulty well casings, fluid spills,) are more frequent in areas where natural gas extraction is active.
Here is my takeaway when I read this report.
  1. The water was low in arsenic and other CoCs before the year 2000
  2. Arsenic, in particular, is higher in wells closer to active gas wells.
  3. That level of arsenic, in almost a third of the wells sampled, is over the MCL
  4. The above MCL level of arsenic now found in the wells happened after the year 1999
  5. Mechanical disturbance of private water wells and industrial accidents (e.g. equipment failure, faulty well casings, fluid spills,) are the most probable cause as they were not present before the year 2000.
I think that's a reasonable conclusion that the majority of readers of the report would come away with.  Now let me add this to the mix.  If the level of arsenic detected in the pre-2000 year historical samples did not change after the year 1999, would that impact the "powerful argument" that natural gas drilling and extraction is the culprit?

Let's look at line 389:
...we chose to evaluate the geographic occurrence and absolute concentration changes for these constituents over time by comparing this study’s data against previous characterizations of groundwater in this region from the scientific literature and a large historical dataset from the same region.
The "plausible scenarios to explain our data" is based on a comparison of the historical dataset up to 1999 with what they found in wells from the same area.  Line 393:
This comparison shows a significant increase in the mean concentration, maximum detected concentration, and MCL exceedances for As, Se, and Sr in our study area when compared to historical data and previous characterizations of these aquifers.
So the historical samples showed "x" amount, and their samples showed "x" plus "y" amount, does this lend credibility to the notion that natural gas drilling and extraction plays a part in this?  If that notion is plausible, because there is more "x" now then in 1999, that notion would be void, if the amount of "x" after the year 1999 has not changed.  At least that's where my thinking goes.

The paper tells me that their historical data was derived from the Texas Water Development Board Groundwater Database Website. So I went there.  And like the good little cynical nerd I am, I downloaded the "Entire Groundwater Database" which is an Access Database.

And being the nerdy-type, I know how to use Access.  So I did this:

Nerdy Query I Put Together from the Texas Water Development Board Groundwater Database

Here is what I got from the query.  Please note that I am sorting by "const_val" (I removed descending from the state_well_number).  What you see in the graphic of the results below is the highest value of arsenic reported in the same wells the historical data they used in the report were collected from.  All the other values, including the ones you do not see, are lower than that.

Report from running the nerdy-query.
I limited the query to just the four counties the Railroad Commission calls "Core Counties."  This is where the bulk of the drilling takes place and where the proximity of a gas well to the groundwater well would be closest.

Notice that this query only shows two wells with levels of arsenic above 2 ppb?  All we need to know is how many samples we have post 1999 and how that would compare to the same query pre 2000.

Time to get nerdy.

Next post: Part 8.


.

Thursday, August 1, 2013

The source of elevated constituents is speculative, but... - Part 6

The paper titled "An evaluation of water quality in private drinking water wells near natural gas extraction sites in the Barnett Shale Formation" states on line 285:
Samples that exceeded the MCL for TDS, arsenic, and selenium were located an average of 1.1 km from the nearest natural gas well. Similarly, the highest values for both strontium and barium were over twice as high in areas less than 2 km from the nearest natural gas well compared to more distant gas wells.
Let's look at the graph with the green, yellow, and red dots.


 Notice that gray shading?  That's all the oil & gas wells in the area.  The Railroad Commission of Texas (RRC) has a web site devoted to the Barnett Shale.  Here is their map.

RRC
Now let's look at the number of wells in the area:

RRC

There are a little shy of 17,000 wells in the area.  That's why there is so much gray in their graphic.  There are four counties where most of these wells exist; Denton, Johnson, Tarrant, and Wise.

The UTA research found that "arsenic, selenium, strontium, barium, and TDS reached their highest concentrations in areas of active extraction in close proximity to natural gas wells."  The source of this arsenic is unknown, but the paper points the reader in the direction of the gas wells as the culprit.
Line 291: The geographic patterns in our data suggest that lowering of the water table during a drought period cannot fully explain these elevated constituent levels.
...and...
Line 293: Concentrations that exceed the MCL occur only in close proximity to natural gas wells suggesting that mechanical disturbances or localized groundwater withdrawals near natural gas wells could play a role in elevated constituent concentrations.
...and...
Line 312: It is also possible that improper handling of waste materials and faulty gas well casings could result in the introduction of these compounds into shallow groundwater
 I think we can rule that last one out due to no BTEX being found in any of the 90 wells they sampled.

So what about the arsenic?  Line 322:
Arsenic showed a significant positive correlation with TDS suggesting that it may be concurrently mobilized into groundwater with TDS during the natural gas extraction process.  Again, mechanical disturbances (high pressure fluid injection, mechanical vibration, etc.) associated with natural gas extraction activities could be the cause of elevated levels of TDS and arsenic.
Now to tie it all together.
  • Line 339: Concentrations of arsenic, strontium, and selenium were significantly higher in samples from active extraction areas compared to historical data.
  • Line 341: Non-active/reference area samples also showed a significant increase in arsenic compared to historical data.
  • Line 342: Both active extraction and non-active/reference areas showed a significant decrease in barium concentrations from historical levels.
  • Line 344: Historical TDS concentrations were not significantly different from non-active/reference area concentrations but were significantly higher than active extraction area samples.
And conclude:
Line 348: While we cannot draw definitive conclusions due to the fact that the historical data was collected under different sampling conditions, these data do provide a baseline for comparison to pre-industrial conditions which is generally lacking in studies of this nature.
From my point of view, if "these data were compared to a historical dataset from the same
aquifers prior to the expansion of natural gas extraction activities," then any impact from natural gas drilling would also show up in those wells post-1999.

The paper's general hypothesis is that "the geographic locations of elevated constituent levels in our study are consistent with the notion that mechanical disturbance of private water wells and industrial accidents (e.g. equipment failure, faulty well casings, fluid spills, etc.) are more frequent in areas where natural gas extraction is active."

If that is true, then the same wells used for the historical data should also see an increase in these constituents, in particular, arsenic. The paper is keen to explain finding no contaminants in other wells close to drilling:
While our data indicate elevated levels of potentially harmful compounds in private water wells located near natural gas wells, it is important to recognize that there were also a number of private water wells in close proximity to natural gas wells that showed no elevated constituents.
I am left with this:
Concentrations were significantly higher in active extraction areas compared to reference samples and historical samples.


That historical data they compare it with - the before and after - came about like this:
Historical data for the concentrations of target compounds (except alcohols) in private water well samples from this region were obtained to evaluate their occurrence before the expansion of natural gas extraction activities. This historical dataset is comprised of 330 private drinking water wells from the Trinity, Woodbine, and Nacatoch aquifers sampled over a ten year period (1989 – 1999) before natural gas activities began. Wells were located in the same counties that we sampled in this study.
This got me thinking.  If the arsenic is elevate due to proximity to a gas well, and "mechanical disturbances (high pressure fluid injection, mechanical vibration, etc.) associated with natural gas extraction activities could be the cause of elevated levels of TDS and arsenic," we would expect to see elevated arsenic in the wells from which the historical data was collected.

You know, kind of a goose and gander type thinking.  I chose Tarrant County to look at since there are a lot of gas wells there and it had a nice cluster of red dots indicating arsenic above the MCL.


The paper cites the Texas Water Development Board Groundwater Database Website as where they got this historical data.  So I went there, scrolled down to "Tarrant County" and went looking for a groundwater well that was in this area.  I then clicked on the "Infrequent Constituent Report." which is where they obtained the pre-1999 data.  I then looked for a water well in the vicinity of the red dots.

Using the "Wells in TWBD Groundwater Database-Texas website, I found a few wells that had post-1999 data.  325103, 325104, and 325102.

Source

I then went to the Railroad Commission's website and searched to see if there were any gas wells in the area.

Source
So looking at groundwater well 3205103 you can see that it is less than 1 km from gas wells.


I then went back to the "Infrequent Constituent Report" and looked at the most recent analysis on arsenic:


Okay, that's just one well.  Look at the green dots in the graphic!  Remember the authors tell us:
...it is important to recognize that there were also a number of private water wells in close proximity to natural gas wells that showed no elevated constituents.
True that, but when I look at the historical data post-1999, I find nothing to support the hypothesis "suggesting that mechanical disturbances or localized groundwater withdrawals near natural gas wells could play a role in elevated constituent concentrations."

So what gives?  Why did they find arsenic above the MCL in 29 of 90 wells they sampled?


Next post: Part 7

.

Wednesday, July 31, 2013

The source of elevated constituents is speculative, but... - Part 5

Without BTEX and methanol, the "powerful argument for continued research” Dr. Fontenot states on the the UT Arlington webpage describing their study titled "An evaluation of water quality in private drinking water wells near natural gas extraction sites in the Barnett Shale Formation" becomes less persuasive.

The paper concludes:
At a minimum, these data suggest that private wells located near natural gas wells may be at higher risk for elevated levels of constituents than those located further from natural gas wells.
No BTEX and methanol in these 92 wells would support the claim that the drilling fluids (fracturing) used are not entering into the ground water.

Based on the graphs they show:


I am in the process of looking at the data Dr. Fontenot sent.  That's going to take me a bit to get into.  Still, looking at these graphs, there are a lot of data points above the threshold (MCL), for arsenic in particular.

What does the paper say about all of this, and does the data support their conclusion?

Line 148:
Water wells [sampled] were overwhelmingly used for drinking water in rural areas without public drinking water systems (n = 82). The remaining wells were used to irrigate private lawns or provide drinking water for livestock (n = 18). To avoid contamination from pesticides, we did not sample water wells that were used for irrigating large agricultural crops.
Line 161:
Four duplicate water samples were collected in 40 mL glass vials without headspace and held at 4ºC during transport to The University of Texas at Arlington for chemical analyses. Because the objective of this study was to assess potential exposure risks of drinking water from wells in this region, we chose not to use filtration and acidification techniques. This allowed us to obtain samples representing the quality of water our participants would consume, as well as increased versatility in the number of constituents that could be probed by analytical techniques.
Okay...that could be problematic.  If you are going to compare a result to a threshold, you need to collect the sample and analyze it in a particular way.

Line 167:
We acknowledge that foregoing filtration and acidification can introduce a negative bias into metals analysis; however, this would result in a conservative underestimation of concentrations. Furthermore, the MCL values for drinking water are based on unfiltered samples that have not been acidified.
I am going to assume that the μg/L they report represent the amount of contaminant that would be consumed.  I do want to address this issue later because it brings in uncertainty which works against considering their "powerful argument."

If the MCL is the threshold they are using to denote the water is not impacted (ignoring the yellow and green coloring scheme they used), then the water should be tested the exact same way that drinking water samples are tested for these contaminants.

I am unsure what the statement "Furthermore, the MCL values for drinking water are based on unfiltered samples that have not been acidified," is based on (I see the citation, not sure why they conclude that to be true).  Here is what I know to be true about sampling arsenic in drinking water.

Source: EPA
The analytical method used by the paper is described as:
Chemical analyses were conducted using gas chromatography mass spectrometry (GC-MS), headspace-gas chromatography (HS-GC), and inductively coupled plasma-mass spectrometry (ICP-MS).
So if ICP-MS was used, EPA method 200.8 should have been used for the arsenic sample.  Footnote number 3 reads:
"Methods for the Determination of Metals in Environmental Samples - Supplement I," EPA-600/R-94-111, May 1994. Available at NTIS, PB 94-184942
In this same EPA document, they also show a table for the preservation of the sample:

Source: EPA
Here is what EPA Method 200.8 says about the sample:
This method provides procedures for determination of dissolved elements in ground waters, surface waters and drinking water.
and...
Dissolved elements are determined after suitable filtration and acid preservation.  In order to reduce potential interferences, dissolved solids should not exceed 0.2% (w/v) (Section 4.1.4).
And here is what the regulation in 40 CFR says:


I am not sure where they came to understand that "Furthermore, the MCL values for drinking water are based on unfiltered samples that have not been acidified," but that's not my take on it.

Nonetheless, they found elevated levels of arsenic in a number of the wells they sampled.  The other three metals, not so much.  I look at the data in their graph and ask "why?"

Here is what the paper says on line 259:
These constituent concentrations could be due to mechanisms other than contamination of aquifers with fluids used in natural gas extraction. For example, lowering of the water table can lead to changes in pH that cause desorption of arsenic and selenium from iron oxide complexes or mobilization of arsenic through pyrite oxidation.
The paper then goes on to say on line 267:
While the regional water table has not decreased dramatically in the last ten years, rural areas with high water withdrawal rates and/or withdrawal of large amounts of groundwater for use in hydraulic fracturing could lead to localized lowering of the water table.
...and then on line 273:
Additionally, pyrite is not found at high levels in these aquifers so it is an unlikely source of arsenic.
 In other words, the lowering of the water table could be the culprit, but the water table has not decreased, ...but it could decrease if the water is pumped for hydraulic fracturing, which would lower the table and release the arsenic from the iron pyrite.  But...there is low pyrite, so the arsenic cant be coming from that, and:
Given the low mobility of applied arsenic and the fact that none of our samples were collected from private wells in or adjacent to crop fields, we find agricultural arsenic introduction is unlikely to be the source of elevated arsenic concentrations.
Which leads them to say this on line 234:
Moreover, if agriculture were the cause of elevated arsenic levels, then concentrations in the historical data would likely have been high as well and we found no evidence of this.
So...because they find arsenic in the samples, and the historical data does not show arsenic, what changed after 1999?
This historical dataset is comprised of 330 private drinking water wells from the Trinity, Woodbine, and Nacatoch aquifers sampled over a ten year period (1989 – 1999) before natural gas activities began.
So...no arsenic in the historical dataset and arsenic in the current samples means that the arsenic is getting into the water most likely from natural gas activities.

That would be how I read their results and findings.  Seems pretty cut and dry, that is, until you look at the historical data after 1999.


Next post, Part 6


.

Tuesday, July 30, 2013

The source of elevated constituents is speculative, but... - Part 4

The UT Arlington webpage describing the study titled "An evaluation of water quality in private drinking water wells near natural gas extraction sites in the Barnett Shale Formation" includes a link to the journal where the paper can be found.  I can't link to it, but it is free to download once you register.

In my last post I was looking at what the paper states and where in the paper the statement is located.  The paper concludes with this:
At a minimum, these data suggest that private wells located near natural gas wells may be at higher risk for elevated levels of constituents than those located further from natural gas wells
I ended my last post asking the question; does the data support that suggestion if you look at all the data available?

On the UT Arlington webpage, Brian Fontenot, the lead author, states:
“This study alone can’t conclusively identify the exact causes of elevated levels of contaminants in areas near natural gas drilling, but it does provide a powerful argument for continued research,”
With that in mind, I am looking at what powerful argument can be made to suggest that private wells located near natural gas wells may be at higher risk for elevated levels of constituents than those located further from natural gas wells?

To start, let's look at this summary table the paper uses after line 706:
Note: Ethanol and Methanol are in mg/L

Now if you recall what they tested for in my last post, you will also notice what they did not find. Here is what line 175 states they tested for:
Arsenic, selenium, strontium, barium, methanol, ethanol, TDS, and volatile organic compounds (VOCs) such as benzene, toluene, ethylbenzene, and xylenes (collectively referred to as BTEX) were the primary targets of chemical analyses.
The absence of VOCs is telling. Here is what the congressional report they cite says about BTEX:
The BTEX compounds – benzene, toluene, xylene, and ethylbenzene – appeared in 60 of the hydraulic fracturing products used between 2005 and 2009.  The hydraulic fracturing companies injected 11.4 million gallons of products containing at least one BTEX chemical over the five year period.
Here is what the paper reports on line 192:
We found no evidence of BTEX compounds using both LC-UV-MS and GCMS.
That statement tells me this:  If I sampled 92 individual groundwater wells in the Barnett Shale area.  And these wells were smack-dab in the middle of natural gas drilling boom happening between 1998 and the present, and I found no evidence of BTEX, I would conclude that my down hole activity and removal is not contributing to groundwater contamination.

Additionally, according to this table from the congressional report...

...methanol appears to be the number one chemical component found in hydraulic fracturing fluids used between 2005 and 2009.  According to the table on line 706, methanol is 1.3 - 329 mg/L in the 92 samples compared to 1.2 - 62.9 mg/L in the samples collected where no active wells are located (reference area).

When looking at the results for the samples collected in Figure 2, line 632, it would appear that two samples are showing results considerably higher than the rest.  I have requested (and now received) a copy of the raw data to run median results as these two high values seem to be skewing the averages, which are reported as a mean.  I suspect that the medians for methanol in the active and reference areas are statistically the same.

Nevertheless, if you look at the methanol results, you will see that they do not show a significant difference between groundwater samples collected in unaffected areas.  This, to me, suggests that  "industrial accidents (e.g. equipment failure, faulty well casings, fluid spills, etc.) are not the cause for contaminants in the 92 groundwater samples collected.

But what about the elevated levels of arsenic, selenium, barium and strontium?  Yeah, about those...Okay, that needs to be explained.  But, once again, the absence of the other materials suggests that the contamination of these materials is not from industrial accidents.  That is, if these industrial accidents were commonplace, as the data showing the number of wells contaminated would indicate, we would also see high levels of methanol and BTEX.  In other words, an accident would not selectively release arsenic, selenium, barium and strontium without also releasing the more prevalent chemical components used in the hydraulic fracturing products.

Okay, so that's BTEX and methanol.  Let's look at the levels of arsenic, selenium, barium and strontium they report.

Next post: Part 5


.