Note: Written June 30th
I know that number will be less than that based on the fact that some of us are taking precautions as well as changes in the way we treat the sick resulting in less deaths. How much of a decrease in my numbers depends on a lot of factors, so worst case of doing nothing will see a lot of deaths, even if you reduce the 70% needed down to 50% for herd immunity.
How does the antibody testing done in New York compare to the testing they did in Boston?
Mayor Martin J. Walsh, together with Massachusetts General Hospital (MGH), and the Boston Public Health Commission (BPHC), today announced the study to evaluate community exposure to COVID-19 through a representative sampling of asymptomatic Boston residents resulted in 9.9% testing positive for antibodies and 2.6% of currently asymptomatic individuals testing positive for COVID-19. In conclusion, approximately 1 in 10 residents in this study have developed antibodies and approximately 1 in 40 currently asymptomatic individuals are positive for COVID-19 and potentially infectious.
Let's do the same process as we did in the last post.
More than 5,000 residents living in East Boston, Roslindale or within the boundaries of zip codes 02121 and 02125 in Dorchester were invited to voluntarily participate in the study, with total outreach representing more than 55% people of color. Approximately 1,000 residents expressed interest in participating and 786 residents were deemed eligible. Of those, 750 residents enrolled in the study and received the required testing. Residents with symptoms or a previously positive COVID-19 test were disqualified from the study.
So...1 in 10 residents in this study have developed antibodies EXCLUDING those who have tested positive and recovered. Let's settle on a date of May 15 for the News Release and May 12 for the last day they looked for antibodies.If we say that everyone's outcome was resolved on May 12, you either had antibodies or you were dead. And if you died, we got your death reported at least by May 19 (7 days).
If this is the case, then the numbers look like this for the IFR:
 |
| Source |
Interesting...An IFR of 0.86% was also calculated with NYC.
Right now we have so reasonable data from which to work. We know dates, we now counts, we can make some calculations and we can make some assumptions. It is unfortunate that we will not know a 'true' number until the end. What we can know are reasonable numbers based on what we see, and, using those number we can rule some things out.
Looking at the data from Boston and NYC as well as the current data as of 6/26/2020, here is what we get:
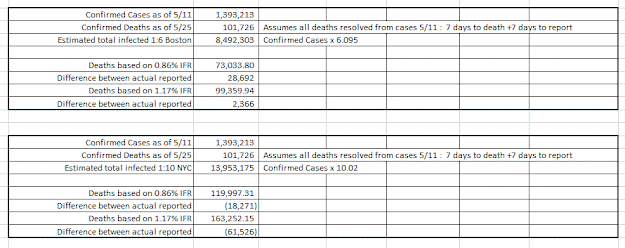
For Boston, we had 11,395 confirmed cases for 69,458 (10% of Boston) assumed past infected.Using these two numbers, we can assume that for every known case (11,395) the are 6.095 times more cases that were not reported.
Using those numbers, we can get an estimate as to how close out calculated IFRs are using US data for the whole country.
If our infected to confirmed cases ratio is correct, then the best fit for the deaths reported is an IFR of 1.17%
If we use NYC's numbers, the ratio of confirmed cases to assumed past infected is 1 to 10.02:
However, that ratio estimates way more deaths then reported.
If we work backwards, that is we have the reported deaths and we have an estimate of infected (as of 5/25), the IFR calculates as follows:
Assuming nothing has changed, that is the same number of non-tested people remains as per Boston (1:6) or NYC (1:10) we should be able to see very close numbers now that we are into this epidemic by another month.
We have death data as of June 26. Assuming there is at least a 14 day lag between a case being reported, death, and posting of that death, we can look at the cases as of June 12.
In my opinion, the best model that takes into account what we have seen based on reporting is the Boston numbers. That is, for every confirmed case there will be six unconfirmed positive cases.
The IFR, however, is a different story. In the beginning it was 1.17% that would get you close to the actual deaths reported. As time goes on, that number drops to 0.8%.
There are a couple of things going on here that could be impacting the IFR:
- The number of deaths from COVID is decreasing due to better care
- More vulnerable have died already
- Less older folks are getting infected with youth driving up the numbers and therefore less deaths from that age group.
- The number of confirmed cases now includes more asymptomatic cases that were not known to be infected early on (decreasing the ratio to be less than 1:6)
To my way of thinking, we should not see to big of a jump in the IFR between what was calculated before May 11 and what has happened from May 12 to June 28 (the latest date I have access to).
The estimated IFRs should hold close, If the IFRs do not calculate the deaths seen from this period, something has changed. I suspect it is all four of the above with number four being the primary driver as we ramp up testing.
Let's go down that rabbit hole and see.
Part 8


