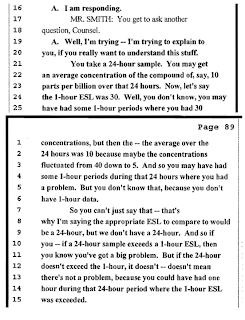
I received via email from Barnett Shale News a copy of Dr. Melanie Sattler's Deposition on December 14, 2010 in Scott & Rebecca Law v. Range Resources Corporation and Range Texas Production, LLC Cause No. 236-236781-09.
Dr. Sattler is an Associate Professor in the Department of Civil Engineering with UT Arlington and is the supervisor for Alisa Rich's Dissertation Committee.
There are a few comments made by Dr. Sattler that help shed some light as to why a particular path was chosen to present data collected from samples taken near a natural gas production site in the Town of DISH, Texas. (Note: This Deposition does not relate to DISH directly, but the same methodology was used, and the DISH modeling report is referenced)
Suffice it to say, I am not impressed with how Dr. Sattler defends the work of Alisa Rich nor of her understanding of exposure and health effects. So these next few posts will look at some of her explanations in the Deposition. First, lets look at this statement:
What this means is that the modeling done for the Town of DISH, Texas, presented in this report, is based on a one-hour concentration worst-case scenario using modeling that utilized sampling data collected over a 24-hour period. Dr. contends that this 24 hour data is diluted:
What this means is that for the Town of DISH, Texas, the concentrations of the following seven chemicals collected over a 24-hour period:
Could potentially be as high as:
By "backing into" the model the 24 hour results a theoretical concentration at the point source was obtained. With that concentration coming out of the pipe (point source), we know that under that sample days weather conditions, that concentration was seen. Using the model, various scenarios were looked at, and the very worst possible condition that could reasonably be expected based on past weather conditions could produce results as high as those in Table 2.
This means that although three samples had Benzene concentrations collected over a 24-hour period of as high as 248 ug/m3, it is - according to the model - just as possible to have a Benzene concentration as high as 473 ug/m3 in a one hour period. OK, maybe. But look at Carbon Disulfide. A high of 320 ug/m3 collected at one spot can jump to as high as 36,000 ug/m3? And that's not just for that sample spot, that's for all receptor locations:
What's a "receptor location"? For this model it was defined as a 3900 m x 3550 m area. Which means that any point within the red square, has the potential of experiencing a concentration of up to 36,000 ug/m3 in a one hour period (unless I am reading the report incorrectly).
At some point one must ask the question: is that even plausible? I mean, if the concentration is that high at the corner of the square, how high would it have to be at the source? This alone should cause one to ponder if "backing into" the model is even viable and/or does the use of 24 hour sampling results distorts the model's findings.
I don't know much about modeling - all that math makes my head hurt - but what I know about concentrations in air over time and distance makes me suspect something ain't right in Dr.Sattler's methodology.
Next Post: Air Quality in the Barnett Shale - Part 15: Dr. Sattler's Deposition - Critique of the Method
.


No comments:
Post a Comment