Showing posts with label cancer potency. Show all posts

Friday, May 25, 2018

Coffee, Acrylamide, and Proposition 65 - Part 8

Here is something interesting that California states when discussing their current list of NSRLs for chemicals "known to the state to cause cancer:"
These safe harbor levels do not preclude the use of alternative levels that can be demonstrated by their users as being scientifically valid. A hyperlink is provided for those NSRLs or MADLs for which the documentation of their derivation is electronically available. (source)
That hyperlink acknowledges that there is information regarding a "derivation" from the established values written into law.

You will notice that there is no hyperlink for acrylamide and cancer. There is a document - the one I have been using - but California doe not link it. That document states this:

If you are good at the maths. you may know this already, but the larger the Cancer Slope Factor (aka Cancer Potency) the lower the NSRL value.

If it were me advising Starbucks et. al. I would have told them to do the following.
  1. Find out the actual (statistically valid) concentration of acrylamide in YOUR coffee.
  2. Find an adequately researched and recognized institution that claims a lower Cancer Slope Factor for acrylamide
  3. Calculate the highest amount of acrylamide seen in the largest dose (cup) of coffee a customer can order.
If that "actual" concentration of acrylamide is less than the new calculated NSRL, plead your case based on California's own words:
These safe harbor levels do not preclude the use of alternative levels that can be demonstrated by their users as being scientifically valid.
Here's how I would do it using new data that I consider valid and demonstrated.

Based on what we know about the average amount of acrylamide in all coffees, we can assume the following for Starbucks:


Using the NSRL established in the March 2005 document, only the Venti would exceed the NSRL. And if "1" is a cancer risk of one in 100,000 and therfore, according to California, a "No Significan Risk Level, what happens when the amount of acrylamide in a Venti is 1.6 micrograms?

Let's go back to my Excel sheet and see if we can calculate the risk when we know the concentration of acrylamide in a Venti cup of coffee:

Okay, so using the Cancer Potency and the NSRL established in the March 2005 document, the added risk of cancer would be and additional 1.3 per 100,000. Since a one in 100,000 is considered a No Significant Risk Level, then are concern is for cancers over the one in 100,000, in this case we would say that we have a risk to consider of 1.3 additional cancers in a population of 100,000.

Remember, as California tells us...:
Cancer now occurs in nearly one out of every four individuals.
So by drinking a Venti each day for 70 years you jump from 25% to 26.3 percent.

But all of that assumes that the Cancer Potency California came up with is accurate. That is, is 0.7 a valid number and better than any other numbers that could be generated?

Let's take a look, shall we?


Source
What this bell curve shows is a bunch of computer simulations, 100,000 trials based on this:
Since acrylamide induced tumors at multiple sites in male and female rats, combined potency estimates were derived for each experiment using Monte Carlo analysis for those tumor sites judged to be associated with exposure to acrylamide. For each tumor site, a distribution of estimates corresponding to the 0.1 through 99.9 percentiles of the linear term (q1) of the multistage model was generated...
If - IF - those rat studies are valid, then the actual number is somewhere in that bell curve. Again, since they force the line linear with 0 as the risk and concentration, the Cancer Slope Factor is questionable. But since its all we got, let's roll with it.

Now if you are not familiar with statistics and bell curves, you need to know this. Between two standard deviations from the mean value (the highest peak in the bell curve) lies 95% of all the numbers it could be. COULD be.

California - to be safe - uses the upper 95% value which is two standard deviations to the right of the mean. That number is 0.70. Where have I seen that number before?


If I were advising Starbucks et. al. I would now get fired because everyone listening to me is bored and falling asleep. Still, I soldier on! I yell:
"If 0.70 is valid, well so is 0.20 because (pant! pant!) both of those number have an equal chance of being the real number with a 95% confidence. I mean...if you are going to say 0.70 is the number you can also say 0.20 is the number. Why do you get to pick the upper when the lower is just as valid?"
Now if the judge could channel King Solomon, he might say "Enough you two! Let's cut that baby in half - 0.50 looks pretty close to the peak - 50% for you and 50% for the state."

Aha! the judge fell right into my trap! I can support that number of 0.50. And if I can support it because California does not...
...preclude the use of alternative levels that can be demonstrated by their users as being scientifically valid.
,,,Then I win for Starbucks et. al. provided the judge agrees with my work.

So the question is, what makes 0.50 a number that you were hoping for Bowman? Well, let me show you...

EPA IRIS Acrylamide 

I think I could make a persuasive argument that the EPA IRIS presents "levels that can be demonstrated by their users as being scientifically valid."

So if I were to present 0.50 as the Cancer Potency (aka Slope), the my NSRL becomes...
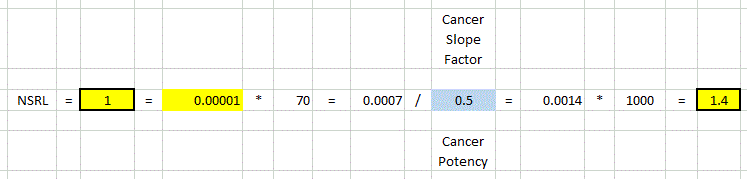

And when we look at the estimated amount of acrylamide in a Starbucks coffee:


Close...but not out of the woods yet. This is why you need to know how much acrylamide is in a Venti. Why they did not go through this is beyond me. Had the amount of acrylamide been similar, they could have fallen back on their original defense. Had it been lower, they could have said "our coffee presents a NSRL for acrylamide."

Now, if I could get the judge to accept 0.50 as the Cancer Slope, the amount of acrylamide is above the NSRL of 1.4 micrograms per day by only 0.20 micrograms, which presents an additional risk above one in 100,00 as follows:


An additional 0.14 per 100,000 cancer risk for drinking a Venti every day for 70 years. I think I may have had a shot at this if I did not bore them to death.


Next Post: Coffee, Acrylamide, and Proposition 65 - Part 9 - The End!

Thursday, May 24, 2018

Coffee, Acrylamide, and Proposition 65 - Part 7


Eight posts on this. Well if you are still reading we are getting close to the end.

Let's go back to this graphic:


If you will recall, I told y'all to pay attention to the writing in blue. The forcing of the line to have zero dose = zero risk is what sets the cancer slope (aka cancer potency).

To determine the concentration whereby you do not need to be concerned - the Not Significant Risk Level (NSRL) - and therefore are not required to notify the public that you have a substance "known to the state to cause cancer," you take the cancer slope value and you plug it into the formula below:

q(human) = cancer potency = cancer slope factor
Let's see how this works for a chemical called 4-methylimidazole. California has a nice document that spells out the Cancer Slope Factor (Cancer Potency) and the NSRL that was calculated using the formula I showed above.


California was nice enough to show their work for 4-methylimidazole so you can see how the NSRL was determined:
Source

You see that value of 16 micrograms in Table 1. You see the Cancer Potency in Table 1. You see the calculation for the NSRL in Table 1. You see the work, the formula, the values.

Can we agree on this as this is how you calculate the NSRL? 

You may be wondering why I am not using the same snip graphics from the California document for acrylamide.Well, that's because they don't show the work. Here is Table 1 for acrylamide:

Source

This looks just like Table 1 for 4-methylimidazole. You will notice that they give the NSRL for acrylamide as 1.0 micrograms per day.

Wait, I have been telling y'all that the NSRL for acrylamide is 0.2 micrograms per day. Where did that 0.2 number come form? It came from their webpage:


I want y'all to know I don't make these numbers up. One of the reasons it take 7 to 10 posts is because I want to make sure the numbers presented are the numbers given.

So what is the NSRL for acrylamide? Is it 1.0 micrograms per day or 0.2 micrograms per day? What does the calculation for the NSRL show?

Source

Oh look! They did not show their work. Okay, I'll just calculate it myself using Excel:


Well, according to my calculation using their formula and their Cancer Potency value, the NSRL is 1.0 micrograms per day.


Let me make sure my calculation is calculating correctly. Ill use the values for 4-methylimidazole to see if I get what they got:


Okay, so my Excel formula works correctly. So where did a an NSRL of 0.2 micrograms per day for acrylamide come from?

The document from which these number came from that I plugged into my Excel formula is dated March 2005. These documents are how the state supports the numbers for the chemicals "known to the state...."  The "INITIAL STATEMENT OF REASONS" - also dated March 2005 gives the same cancer potency and NSRL of 1 microgram per day.


According to Title 27 for the California Code of Regulations §25705 "Specific Regulatory Levels Posing No Significant Risk" the NSRL is 0.2 micrograms per day.


It appears that, by citing 25705(c):
NSRLs may be based on: an assessment conducted by another state or federal agency (Section 25705(c)). (source)
Okay, then what is the March 2005 document all about? If they calculated the NSRL using a different Cancer Slope Factor (aka Cancer Potency), then where is the supporting data? Where did 0.2 micrograms per day come from?

Show your work!

Everything involving this court case, all the news articles, all the bloggers talking about it use 0.2 micrograms per day for the NSRL. Why? because that's the number that appears on the California Proposition 65 website for NSRL values.


Way back in 1992 this document had the Cancer Potency for acrylamide as follows:


Maybe they changed the Cancer Slope Factor (aka Cancer Potency) from 0.7 in 2005 to something else in 2018? Let's check the California Website for acrylamide to see:


Source


Wait...that oral slope factor is the one they used in 1992. Ahhh...I think I may know what happened. I think they got their apples mixed up with their oranges. Is it possible to have the same Cancer Slope for an inhalation dose and an ingestion dose? My thinking seems to be supported by this:
Historically, toxicity concerns over acrylamide centered on worker health and safety, primarily for neurological, male reproductive and cancer effects. However, in 2002 it was discovered that acrylamide can form during the cooking of starchy foods at high temperatures. This unexpected discovery shifted the concern for health risks to the public from acrylamide in the diet. Since 2002, acrylamide has been discovered in many plant-based foods that have been baked or fried at high temperatures. (source)
It appears though that this new look, March 2005, was not adopted into regulation so it still stands that the NSRL for acrylamide is 0.2. It should be, based on data - no lower than 1 micrograms per day as pointed out at the beginning of this post.

Now we can go all the way back to my first post on this. Is 0.2 micrograms a "real" number? Again, ya' gotta know that number because what ever that number is, above it presents a significant cancer risk according to California.

If 1 micrograms per day is a "real" number - or closer to the real number for a risk above one in 100,000 - then that Short cup of coffee - at 0.66 micrograms of acrylamide per cup - no longer poses a "significant risk" for cancer...based on how California looks at it.

This is why that writing in blue in the graphic at the top of the page is so critical to remember. millions of dollars are wasted over these NSRLs. It appears to me that the 0.2 micrograms per day established for acrylamide is wrong. legally it is correct, but calculation wise it is wrong.

Now add in the fact that the Cancer Slope Factor is derived by forcing the line from which the slope is determined mathematically, is assumed to begin at 0 risk and 0 dose.

Having fun yet?


Next Post: Coffee, Acrylamide, and Proposition 65 - Part 8

Coffee, Acrylamide, and Proposition 65 - Part 6

California contends that any product consumed that has less than 0.2 micrograms of acrylamide can be considered as presenting no significant cancer risk.

Cool...

Now let's look at Starbucks et. al. They sell a cup of coffee in California. Coffee, we are told, contains the chemical "acrylamide," and acrylamide is known to the state to cause cancer.
Scientists believe the acrylamide in food is a product of the Maillard reaction. This reaction occurs when sugars and amino acids are heated above 248° F, or 120° C. (Source)
Okay...

With that knowledge, a couple of things come into play. First, because the acrylamide shows up as part of the process in roasting the coffee, it does not meet the definition of "naturally occurring" (and therefore can be ignored.) Second, we are told that a product that contains less than 0.2 micrograms of acrylamide presents no significant cancer risk.

How much acrylamide is in a cup of coffee?
One single cup of coffee (160 ml) delivered on average from 0.45 micrograms acrylamide in roasted coffee to 3.21 micrograms. (Source)
Starbucks sells coffee in  Short (8 oz.), Tall (12 oz.), and Venti (20 oz.). 160 ml is equal to 5.4 ounces.

the smallest dose that we can get from Starbucks then is an 8 oz  cup.

So...we can assume there are 0.45 micrograms per 5.4 ounces or 0.08 micrograms per ounce.

Which means the smallest dose of coffee from Starbucks - a Short - contains 0.66 micrograms of acrylamide. That's 3 times more than the amount that California states presents no significant cancer risk.

This means that drinking a Short cup of regular Starbucks Coffee jumps from a one in 100,000 cancer risk to about three in 100,000.

Or, if the background chance of cancer in a lifetime for a population is 25% - one in four - then drinking one Short  cup of regular coffee from Starbucks - each day - for 70 years - jumps your chance of cancer from 25,000 per 100,000 up to 25,003 per 100,000.

That number - 25,003 is three additional cancers in a lifetime - 70 years - over a background of 25,000 cancers we expect to see - estimated from drinking a Short (8oz) cup of Starbucks everyday for 70 years. Hey, its possible.

That number - "three additional" - is only "real" if the math is correct. And therein lies the problem with all of this. Is the "three additional" not just probable, but even possible?

California tells us that:
The Proposition 65 “no significant risk level” (NSRL) is defined in regulation as the daily intake.
We discussed this in a previous post. The NSRL is the daily intake for which California tells us presents no significant cancer risk. It is the amount that our calculation tells us would present no more than one additional cancer in a 70 year lifetime per 100,000 people.

Where am I going with this? Let's look at what we are faced with when we look at acrylamide in something we consume. There will be a:
  • Concentration that gives us one additional cancer is a "No Significant Risk Level - NSRL
  • Concentration that gives us two more cancers, for a total of three, is a significant risk level and requires notification.
Up to 0.2 micrograms of acrylamide in your coffee is okay - no notification - no significant risk.
But once you exceed 0.2 micrograms in one cup sold, then you need to be notified of the risk.

The problem here is that California does not look at this risk in any form of degree. Once you exceed the NSRL you present a significant risk. Three in 100,000, 300 in 100,000, 30,000 in 100,000...are all looked at the same.

The question that I ask is this: Is the public better protected knowing that the acrylamide in a Short cup of coffee presents a three in 100,000 cancer risk? If a cancer risk of one in 100,000 presents "no significant cancer risk," then how much concern should there be when you jump to three?

And since we are so close in what is present and the NSRL, how confident are we in that number that claims no more than one additional cancer in 100,000? The difference between notification and not having to notify is a big deal for a company that sells food.

If you are going to spend time going to court and printing up notices, and working to convince the public are product is safe, then the number 0.2 micrograms per day had better be a real number.

Is it?

How did they come up with that number, 0.2 micrograms per day?

I'll show you...


We are going to spend the next post or two looking at the math. To get to 0.2 micrograms we had to know the cancer potency. What is that? Here is what California states:
Cancer potency factors may also be referred to as “cancer slope factors”. 
Once we know the cancer slope - the cancer potency - we plug it into that formula and it spits out the NSRL. 0.2 micrograms was derived from a cancer slope that was determined by forcing the line through the data so that zero dose = zero cancer risk. Right out of the box. we now no that the cancer slope is not a real number. It is a number that we agreed on because someone said at some time that any exposure presents a cancer risk.

So here we are in 2018 using that same line of thinking even though a lot of us think its wrong and carcinogens behave similar to non-carcinogens and not a straight line - linear - for 0 dose/0 risk.

To get to the NSRL of no more than one in 100,000 additional cancer risk, you need to calculate the cancer slope (cancer potency).

Let's have some fun shall we?


Next Post: Coffee, Acrylamide, and Proposition 65 - Part 7

Monday, May 21, 2018

Coffee, Acrylamide, and Proposition 65 - Part 5


In the case of acrylamide in coffee, how do we establish there is a "significant amount" of acrylamide "in the products they purchase?"

Based on what we know so far, California has established a "Safe Harbor" concentration of 0.2 micrograms per day. Any thing that is at this concentration or less in the "products they purchase" would never have to be disclosed.

That is, California has determined that your need to be warned ends when the concentration of the chemical presents a cancer risk of less than one additional cancer in 100,000. Less than 0.2 micrograms that would be consumed when using the product, would not require the warning:
“This product can expose you to a chemical [or chemicals] known to the State of California to cause cancer."
let's make sure we are all clear on this. 0.2 micrograms presents a cancer risk that California tells us that y'all don't need to worry yer perduy lil' head about this here chemical. Which means we go back to that proverbial line in the sand...


That line - threshold - for acrylamide is 0.2 micrograms per day. We don't say that less than 0.2 micrograms is "safe" what California claims is this:
...such chemical shall be deemed to pose no significant risk within the meaning of Section 25249.10(c) of the Act.
Section 25249.10(c):
 An exposure for which the person responsible can show that the exposure poses no significant risk assuming lifetime exposure at the level in question for substances known to the state to cause cancer...
So on the "Safe" side of the line in the sand lies acrylamide at a 0.2 micrograms/day concentration that "pose no significant risk."

Which means what for the other side of the line? If on one side it poses "no significant risk" does the other side of that line therefore pose a "significant" risk? If less than one in 100,000 is "no significant risk", is 1.01 in 100,000 a "significant" risk? What about two in 100,000?

Oh what a corner Proposition 65 painted us into.

This now requires us to get back into some math. That risk calculation of one in 100,000, or 1.01 in 100,000, or 2 in 100,000 is calculated based on that linear line we have discussed. Remember, that line is forced so that zero dose = zero risk.


Let's look at a recognized definition of cancer risk:
A slope factor is an estimate of a chemical’s carcinogenic potency, or potential, for causing cancer. If adequate information about the level of exposure, frequency of exposure, and length of exposure to a particular carcinogen is available, an estimate of excess cancer risk associated with the exposure can be calculated using the slope factor for that carcinogen.
...an estimate of excess cancer risk can be calculated...
 Specifically, to obtain risk estimates, the estimated chronic exposure dose (which is averaged over a lifetime or 70 years) is multiplied by the slope factor for that carcinogen.
So that number of 0.2 micrograms per day for acrylamide was determined as the dose that would get an “excess cancer risk” of one cancer above the background chance would appear in a population of 100,000 people.

Here is how the ATSDR guys define it for a cancer risk of one in 1,000,000:
Cancer risk is the likelihood, or chance, of getting cancer. We say “excess cancer risk” because we have a “background risk” of about one in four chances of getting cancer. In other words, in a million people, it is expected that 250,000 individuals would get cancer from a variety of causes.
This is a bit misleading here. Acrylamide risk is based on cancer from acrylamide exposure. We would need to know the background risk of the cancer associated with acrylamide. However, this still works as they are telling us that if you did not drink coffee your chance of cancer is 25,000 in 100,000. If you drink coffee with 0.2 micrograms each day, for 70 years, your chance of cancer is 25,001 in 100,000.

Here is how the ATSDR explains it based on the one in 1,000,000 cancer risk:
If we say that there is a “one in a million” excess cancer risk from a given exposure to a contaminant, we mean that if one million people are exposed to a carcinogen at a certain concentration over their lifetime, then one cancer above the background chance, or the 250,000th cancer, may appear in those million persons from that particular exposure. In order to take into account the uncertainties in the science, the risk numbers used are plausible upper limits of the actual risk based on conservative assumptions. In actuality, the risk is probably somewhat lower than calculated, and in fact may be zero. [ATSDR]
Here is what that calculation looks like for determining the Safe Harbor NOEL for a chemical "known to the State of California to cause cancer." This is how 0.2 micrograms per day for acrylamide was calculated. Note: The term "potency value = slope factor.


Now that we have that out of the way, let's look at the calculated cancer risk that California would claim is in one delicious cup of Pikes.


Next Post: Coffee, Acrylamide, and Proposition 65 - Part 6

Saturday, January 4, 2014

If they only had a RCRA permit...Part 7

Does Exide pose an imminent or substantial risk to the community?

The DTSC ordered Exide to cease operation on April 24, 2013 claiming that:
16.1 In a letter dated March 1,2013, the SCAQMD advised Exide that the HRA submitted by Exide in January, 2013 indicates the Facility poses a maximum individual cancer risk (MICR) of 156 in one million for an offsite worker receptor about 300 meters northeast of the Facility (primarily arsenic).
In addition to compromised stormwater piping that Exide self-reported, the HRA values for cancer and non-cancer risk were also used by the DTSC to claim the need immediately shut down operations on the grounds that these two situations met the 25186.2 conditions for DTSC action "necessary to prevent or mitigate an imminent and substantial danger to the public health or safety or the environment."

Assuming that fixing the stormwater pipes corrects and mitigates that issue, does Exide pose a "maximum individual cancer risk" now or at the time of the DTSC notice to cease?

Looking at Exide's HRA:


You will notice that arsenic is the primary contributor to the risk number that was quantified.  In the RRP, Exide states:
Analysis of the HRA results and concurrent research determined that approximately 90 percent of the above-tabulated risks were due to emissions of arsenic from the Hard Lead Ventilation System stack and that the source of that arsenic was the “leakage” of blast furnace process exhaust from its primary ventilation system into hooding served by the Hard Lead Ventilation System.
So if both Exide and the DTSC conclude that arsenic is the chemical of concern for the risk, eliminating or reducing the amount of arsenic put into the air would reduce that risk.  Exide made some modifications to their equipment and went back into the original numbers and recalculated the theoretical risk:
Promptly after AQMD approval of the HRA on March 1, 2013, Exide designed an isolation door on the charge chute to the facility’s blast furnace to minimize the potential for blast furnace process exhaust gases to be drawn into the hooding served by the Hard Lead Ventilation System. This door system was permitted on March 28, 2013, and became operational on April 4, 2013. This door remains closed except to open briefly when charge material is actually being added to the furnace, only a small percentage of the time. (1)
What if instead of calculating a theoretical risk we could agree on something a little bit more quantitative and easier to understand.  Let's makes some assumptions and hold them as true.
  1. Exide should only be held accountable for the risk they pose over background.  That is, if you take Exide out of the equation and there is no difference in the amount of arsenic in the air, then the same risk is still present.  Exide is responsible for what they put in over that baseline.
  2. We will assume that the cancer potency the SCAQMD used for arsenic calculates a risk of 16 in one million for one nanogram per cubic meter of air.
  3. We will assume that the data collected by SCAQMD and reported in this document accurately reflects the actual amount of arsenic in the air near the Exide Vernon facility.
  4. We will assume that April 4, 2013 the facility was in operation with the new controls put in place and on April 24, 2013 operations ceased.
  5. We will assume that "the last week of June" is the 24th of June to indicate when Exide resumed operations.
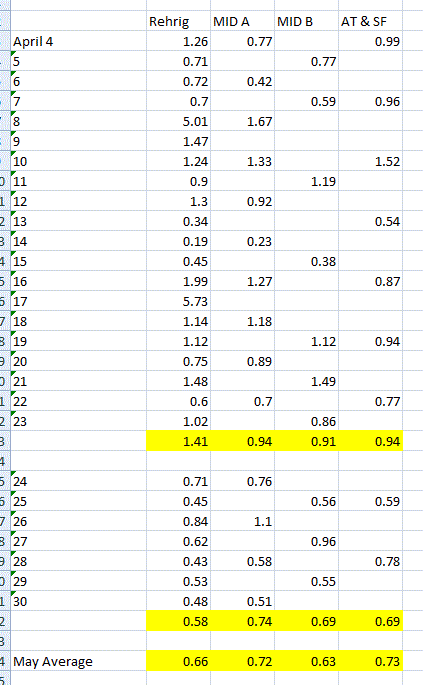
What I am going to do is calculate the average arsenic concentrations for each of the monitors based on the data presented in the SCAQMD document.  I am going to do this for the following periods:
  • April 4 to April 23 (new controls in place)
  • April 24 to June 23 (Exide not in operation - background)
  • June 24 to September 30th (Exide in operation last date for data provided)
I'll attach at the bottom of this post a gif of the spreadsheet I used to show the numbers that went into calculating these three time frames.  Here is what I came up with:


Based on where these monitors are placed...:

SCAQMD

According to SCAQMD's graph:

Source
The SCAQMD states that an average concentration of 1 nanogram per cubic meter equates to a lifetime cancer risk of 16.6 additional cancers.  I am not sure how they calculated that risk because it does not seem to jive with their written methodology for calculating cancer risk.

Based on California's 2003 "Air Toxics Hot Spots Program Risk Assessment Guidelines" the formula for calculating excess cancer risk look like this:

Appendix I - 4
The Inhalation Dose is based on this formula:

Appendix I - 2
Using their arsenic example for calculating the dose...:

Appendix I - 3

...I replaced 0,0015 micrograms with 0.0001 micrograms (1 nanogram).  The inhalation dose, based on 1 ng/m3 equals 3.8 x 10⁻⁸ mg/kg-day

To calculate the cancer risk per million, I replaced the Inhalation dose in the following example with the one calculated based on 1 ng/m3:

Appendix I-4
Based on an exposure of 1 ng/m3 the inhalation cancer risk is 0.45 chances per million.  That number is consistent with the cancer risk calculated by the WHO (0.66). [Cancer Potency checked 2011 most current]

So what does all this mean?

The DTSC gave an immediate cease operation order to Exide based on "imminent and substantial" harm to the public, claiming that:
Based on the Health Risk Assessment submitted to the SCAOMD, DTSC has determined that the Facility is operating its furnaces and its air pollution devices in a manner that is not sufficiently protective of human health and the environment, impacting as many as 110,000 residents in a large geographical area...
The HRA is a theoretical exposure calculated by Exide.  The graph SCAQMD put together represents actual concentrations of arsenic in the air. Before the order to cease operations was given by DTSC the SCAQMD had been collecting arsenic concentrations in the air in and around the Exide facility.

The SCAQMD calculated the highest monthly average of 3.33 ng/m3 from the off-site ATSF in May of 2012.  Assuming that all of that arsenic came from Exide - less the background I calculated (0.75) - this would give us a concentration of 2.58 ng/m3.

2.58 ng/m3 exposure equals a dose of 9.7 x 10⁻⁷.  With that dose, using the California HotSpot calculations, the excess cancer risk would be 11.67 in one million.

Would the highest amount calculated - before the modifications were made - be considered "imminent and substantial"?  That depends on how those two terms are defined.  Here is what the SCAQMD defines as "significant" in their Rule 1402:


Under the rule for air emissions, a cancer risk of 11.67 per one million would equal a risk of 0.11 per one hundred million and would not be considered "significant."

All of this information was available to the DTSC.  Heck if I can find it just using Google and a team of me, myself, and I, so could the DTSC.


Next Post: If they only had a RCRA permit...Part 8


__________________________


Friday, October 5, 2012

Arsenic in Rice: Part 13 - It's There, You Just Can't See It.

Wow, 12 posts already, my, I do like to ramble.

And ramble on I will!  There is a reason for this rambling I do, and that is one of soundness.  I am calling Consumer Reports out on their recent report on arsenic they found in samples of rice they tested.  I am making a case that the amount of arsenic they found and printed in red does not warrant the use of the terms "troubling," "worrisome," "cause for concern," or "potentially harmful."

I could just stop at one post and call them a bunch of cotton-headed ninny muggins and be done with it.  And even though I would be right that there is not cause for concern, without supporting my contention, I would be no better then them.

Consumer Reports bases "troubling," "worrisome," "cause for concern," or "potentially harmful," because some rice exceeded a threshold:


For me to say there is no health concern at the maximum concentration of inorganic arsenic found, 9.6 ppb, means I have to show why Consumer Reports concern is not warranted.  The previous 12 posts have focused on what that threshold of 5 micrograms actually means in terms of risk as well as tried to show how exceeding it up to 9.6 ppb does not pose a health concern.  I tried to do this by  by showing how New Jersey came up with the number "5" and how it is dependent on a Slope Factor that most likely does not represent the true risk it theoretically calculates.

If exceeding 5 micrograms per serving is "troubling," "worrisome," "cause for concern," or "potentially harmful," then rice below that amount is not.  And if 5 micrograms is safe, then we assume a certain number of excess bladder and lung cancers is therefor acceptable.  But we can only accept those excess cancers at 5 micrograms if the Slope Factor they used actually reflects the real risk.  And when we look at the actual risk at low levels of arsenic in drinking water, the researchers find:
Since the NRC reports, a number of studies have been published that did not find an increase of internal cancers at low level arsenic exposure. These include Guo (2000), Steinmaus (2003), Lamm (2003, 2004), and Bates (2004), all of which found no evidence of an increase in bladder cancer rate at low-level arsenic exposure levels. Both Guo (2004) and Chen CL (2004) found no increase in lung cancer rate at low-level arsenic exposure levels.
Which means when Dr. Lamm reports:
  • An ecologic analysis of the white male bladder cancer risk in the United States found no increase over an arsenic exposure range of 3–59 μg/L (ppb).
  • Case–control bladder cancer studies found no increased risk in the United States for exposures less than 80 μg/day (ppb).
...and we take those numbers, a maximum of 59 ppb and 80 ppb, finding 9.6 micrograms in one rice serving sample will show no increased risk for bladder or lung cancer.

Dr. Lamm, Dr Honeycutt, and the National Rural Water Association lead me to conclude that the Slope Factor - used by New Jersey and the EPA in the draft IRIS document - from data presented by Morales - is incorrect and does not represent the true risk of lung and bladder cancer seen at low levels.

Not so fast, say the NRC researchers:

NRC 2001 Arsenic in Drinking Water

Which leads them to write this:

NRC 2001 Arsenic in Drinking Water

So you mean to tell me that you can calculate the risk from data collected for "Liver, lung, and bladder cancer mortality data [that was] collected from death certificates of residents in 42 villages during 1973 through 1986"....

....And you can make a Slope Factor based on arsenic concentrations in the drinking water wells "collected from wells in the 42 villages between 1964 and 1966" (1)....

...And then you tell me that you cannot calculate the low level risk from the current data available in the US because of "unknown distribution of other risk factors?"

Really?  Tell them what I think about that Col Potter:


Here is what Dr. Lamm points out:
If an ecological study in the range of interest is desired, then the data are available for analysis from US government sources. These data would obviate the need to make speculative assumptions of differences in body weight, fluid consumption, nutritional status, etc. between the study population and the US population.
And here is what the EPA is concluding should be the Slope Factor and risk for arsenic

EPA IRIS

At that Slope Factor, we would expect to see 7.3 excess cancers in 1000 (7.3E-03).

Dr. Honeycutt with the TCEQ says "horse hockey" as well:
For bladder cancer alone, the incidence risk calculated by USEPA based on final draft values for males/females is 3.1E-04 per μg/L. Therefore, based on 2 μg/L as an average drinking water concentration, the estimated bladder cancer risk for the US population would be 6.2 per 10,000 or 62 per 100,000. However, the actual occurrence of bladder cancer in the US is about 23 cases per 100,000 (males/females combined). It would take 3 times the actual bladder cancer incidence for US males/females combined to even make possible the 62 cases per 100,000 estimated due to arsenic exposure from drinking water alone. Thus, the incidence risk calculated by USEPA final draft values for bladder cancer appears to be inaccurate and overly conservative.
Okay, so I have beat the hell out of this dead horse on Slope Factor.


If I have not supported by argument that the Slope Factor is incorrect, and, therefore the 5 ppb is incorrect, there is not more evidence I can offer.  I can say, based on what I have shown in these previous 13 posts, that rice that may go as high as 9.6 μg per serving is not "troubling," "worrisome," "cause for concern," or "potentially harmful."  It is just rice.

I have also concluded this as well about how a Slope Factor for cancer risk is calculated:
The ability to fit a line through data points does not necessarily mean that the underlying data adequately define the shape of the dose-response curve, including the critical low dose region.
(Honeycutt TCEQ)


Next Post: Arsenic in Rice:  Part 14 - Give me a "P"...Arsenic in the Urine

.

Thursday, October 4, 2012

Arsenic in Rice: Part 12 - Look No Closer Than Your Own Backyard

The real problem with Consumer Reports articles on arsenic in apple juice and rice is that it shows concentrations of arsenic that are not "troubling," "worrisome," "cause for concern," or "potentially harmful."

The rice report, specifically, conveys to the public that there is a risk by showing rice samples with arsenic concentrations printed in red.  This table of inorganic arsenic they found in the rice they samples is explained like this::


What message does Consumer Reports want their readers to leave with?  Should they stop consuming rice? Buy only brands without out the "red" numbers?  Throw out the rice they have in their pantries?  What should be done?

What, other than "troubling," "worrisome," "cause for concern," or "potentially harmful," will the average reader conclude when looking at those results?

This is the problem with a threshold.  Safe on one side, unsafe on the other.  What Consumer Reports and their experts are either woefully ignorant of, or are be purposely misleading, is that the New Jersey threshold of 5 ppb does not in itself mean "safe" nor does exceeding it by twice the amount, in this case 9.6 ppb (the maximum inorganic arsenic Consumer Reports detected) mean "unsafe."

That 5 ppb "limit" is nothing more than a number New Jersey wants based on the Slope Factor that shows a one in one million excess bladder/lung cancer risk of 0.003 ppb.

My point - and maybe i made it long ago - is that 5 ppb is just a number that can be obtained, it is not a number that exceeding it is "troubling," "worrisome," "cause for concern," or "potentially harmful."  It came about from a Slope Factor based on data from an ecological study from a high exposure population in Taiwan.
The Taiwanese dataset [data underlying the study Wu et al. (1989) study and the analyses in Morales et al. (2000)] has been analyzed by the NRC (1999; 2001) and the EPA]. It has served as their analytic database for estimating the risk of internal cancers from the ingestion of water containing inorganic arsenic. NRC considered that the reason for modeling with the SW-Taiwan data was that at that time there was insufficient information to assess the risk from low-level exposure and only the SW-Taiwan study had a sufficient quantity of data over a wide range of arsenic exposures that could be used for risk analysis and extrapolation. (Lamm 2005)
That same dataset is also being used EPA to lower the MCL of arsenic to 3 ppb, and it is based on the Slope Factor derived from that data.  That Slope Factor, the one that leads Consumer Reports to 5 ppb "limit" and is sending the EPA towards a 3 ppb limit, is being questioned as to its validity and the potential damage it will cause if it is adopted if it is indeed incorrect.  As Dr. Honeycutt with the TCEQ tells the EPA:
Proceeding with this SFo will unnecessarily alarm the public by giving a greater perception of harm and risk than is actually taking place.
Dr. Honeycut is not the only one who takes issue with the draft IRIS report and the Slope Factor derived from the Taiwanese dataset.  Here is what the National Rural Water Association wrote about this draft IRIS report:
High quality data from the US and elsewhere indicate much lower risks from iAs ingestion at the levels of exposure relevant for the past and current MCL, yet these studies are not used at all in the Agency’s new quantitative risk assessment because EPA focuses exclusively on the Taiwanese data.  
I know what you may be thinking: Well of course those two are opposed to a lower standard!  It's going to cost them money and effort!  Yeah, that could be the driver, but in the end, is what they are saying, their "point" sound?  Heck, even though I have no dog in this hunt, I have used 12 posts to support my point, and I got a lot more support I am going to throw out there.

Okay, so I'll give you the bias angle, is there anyone else that takes issue with the EPA and the dataset used to determine the Slope Factor?

Well I found something written by this guy named Steven H. Lamm.  He is an MD and an MPH (like me) and bills himself as a "Consultants in Epidemiology & Occupational Health, LLC. with Johns Hopkins University-Bloomberg School of Public Health Georgetown University School of Medicine."

I found a letter from him to the EPA Science Advisory Board (SAB), dated September 5, 2005.  He writes:
There are many questions regarding data quality that are raised by the above analysis. Are the diagnoses correct? Is the case count correct? Is the population ascertainment and subsequent person-year distributions correct? Is the well inventory complete and accurate? Are the arsenic measurements correct? Did the residents only drink from their village wells? Was the arsenic level constant over decades? Were the risks independent of subsequent switch to piped water both quantitatively and temporally?
What becomes troubling about the Slope Factor the EPA wants to use is that they seem to be ignoring this:
As the data to examine these questions is limited or absent, we have to accept various assumptions. We are struck with the observation that in multiple ways when the data is bifurcated, the dose-relationship differs in the two sections. We conclude that there exists within the data some additional unobserved factor(s) that influences the outcome, but has not been adequately identified or characterized. Lamm
And now the plot thickens.  Remember how the Rural Water guys said "High quality data from the US and elsewhere indicate much lower risks from iAs ingestion at the levels of exposure relevant for the past and current MCL?"  Well here is what Lamm reports to the EPA - using the same data used by the EPA:
We noted that the lower level exposure villages showed a negative slope with R2 = 0.25, which appears to be inconsistent with the general expectation of a dose-response model, though p=0.10.
The SW-Taiwan dataset reflects significant inherent geographically-based risk factor(s) which, when disentangled, reveal no significant arsenic-dependent risk for bladder and lung cancers for the low-level exposure villages.
"Disentangled,"  hehe, MPH's use funny words.

Well now...where does all this lead us?  Dr. Honeycutt complains about the noise, Dr. Lamm says the lower dose-level exposed Taiwan villagers reveal "no significant arsenic-dependent risk for bladder and lung cancers," and The National Rural Water folks wonder why the EPA is not looking at "data from the US and elsewhere indicate much lower risks from iAs ingestion at the levels of exposure relevant for the past and current MCL."

That's a good question, that last one.  Why don't we look at US exposure to arsenic and compare bladder & lung cancer incidence based on exposure?  I mean, to me, that would show if these low levels of arsenic actually do present the same degree of risk the EPA's new Slope Factor is predicting.

I mean, wouldn't current data using American's with American habits and American data on cancer make a much better study group?  Has that been looked at?  Why yes, yes it has.  According to Dr. Lamm in Environmental Health Perspectives 2006 July; 114(7): 1077–1082:
  • An ecologic analysis of the white male bladder cancer risk in the United States found no increase over an arsenic exposure range of 3–59 μg/L (Lamm et al. 2004). 
  • Case–control bladder cancer studies found no increased risk in the United States for exposures < 80 μg/day (Steinmaus et al. 2003)
Interesting...

Dr. Lamm finds:
  • A threshold-like model indicating that the bladder cancer mortality risk does not increase with exposure levels < 150 μg/L is consistent with other epidemiologic data.
  •  Cigarette smoking still remains a risk factor for bladder cancer.
So here is my take on this.  We have really, really good data on the arsenic concentration in water that is consumed.  For example:

Evaluation of Arsenic Contamination in Texas
...and we have really, really, good data on cancer

Source

So putting the two together, me thinks we would see elevated incidence of bladder and lung cancer in areas where the arsenic is highest and less in areas where the arsenic is low.  At least that data would be newer and more complete and any confounders present would be relatively the same as in Taiwan.

Makes sense to me to look here as well as there.


Arsenic in Rice: Part 13 - It's There, You Just Can't See It.

.

Wednesday, October 3, 2012

Arsenic in Rice: Part 11 - Dose-response is the cornerstone of toxicology

From 2010 Draft IRIS we learn:
In response to comments from NRC and SAB, a slightly different approach to estimate cancer risks for U.S. populations is being used. In the following analysis, arsenic concentrations corresponding to an additional 1% lifetime cancer incidence (effective dose; ED01 values) above “background” are derived for each endpoint [bladder/lung cancer].

A little primer on EDs...
NRC

 Using the Morales et al. data, the EPA IRIS reports:
Depending on the model used and the comparison population used in the analysis, the effective dose at the 1% level (ED01) estimates ranged from 21 to 633 ppb for male bladder cancer, and from 17 to 365 ppb for female bladder cancer. The lung cancer risk for males was found to be slightly higher than the bladder cancer risk, with ED01 estimates ranging from 10 to 364 ppb.  The risk for female cancer tended to be higher than that of males for each cancer type. For lung cancer, female ED01 estimates ranged from 8 to 396 ppb.
What this means is that the concentration required to obtain an additional 1% cancer incidence for male bladder cancer is either 21 ppb or 633 ppb, depending on what model you use.

Why this is important, this variation of 21 or 633 needed to get the same result - an additional 1% cancer incidence for male bladder cancer, shows up here (draft IRIS):
Also derived are lowest effective dose (LED01) values, which represent the lower confidence limits on the dose corresponding to a one percent lifetime incidence risk in the U.S. population.  [R]isk estimates are derived based on a linear extrapolation from the points of departure (LED01s for lung, bladder, and combined cancers) because the [Mode of Action] MOA for inorganic arsenic is unknown.
What this means, if I am understanding it correctly, is that depending on what model is used, an ED01 is produced.  This ED01 is a statistically derived number and will have a 95% Confidence Interval produced, and the lowest number of that range will produce the LED01.  That number is what is used to produce the Slope Factor which is used to produce the risk of excess cancers which is then used to determine the "safe" dose - the line in the sand - the threshold.

You can see these values, the ED01 and LED01, in Table 5-3:

Draft IRIS Page 131
I can't really do the math here any justice, but what you can see from this table is that the LED01, which is the lower confidence interval, and is used to produce the line (linear extrapolation) from which the Slope Factor is determined, which represents the theoretical potency, which determines the risk (1 in 1,000,000 or 1, 10,000) was based on the lower values spat out by the different models used to calculate the ED01.

...in the house that Jack built!

Confused?  Me too, kind of.  What this shows is that when calculating the Slope Factor the lowest concentrations of arsenic that showed came out of the models were used.  This being the case, with a range of ED01 anywhere from 21 ppb or 633 ppb, for example, means that the risk calculated from these Slope Factors are extremely high.  With that in mind, a serving of rice that has inorganic arsenic 5 ppb over the 5 ppb threshold established by New Jersey is probably no more hazardous for lung/bladder cancer than if it was 5 ppb below that value.

Because the Slope Factor is dependent on a linear extrapolation of the LED01 the numbers used to calculate the ED01 must accurately reflect an additional 1% lifetime cancer incidence above “background.”  

EPA reports in the draft IRIS that these numbers were from 21 ppb or 633 ppb for male bladder cancer depending on what model was chosen.  How far of, then, the Slope Factors are from reality (actual incidence of excess bladder/lung cancer) is anyone's guess.

What there is no guessing about is this.  Eating a serving of rice containing 9.6 μg every day - for 70 years - would not be "troubling," "worrisome," "cause for concern," or "potentially harmful."

But don't take my word for it.  Let's look at what the National Rural Water Association wrote about this draft IRIS report:
The most likely  [Mode of Action] MOA for arsenic correspond to sublinear dose-response models, which when fitted to the available data, suggest much lower cancer risks (by a factor of up to 200) at exposure levels at or below the MCL when contrasted to the EPA’s estimates from the linear model.
..and:
Since the MOA could not be established, the EPA is continuing in its application of the linearized, non-threshold model of dose-response, despite a lack of evidence of increased cancer incidence at typical environmental levels of exposure in the U.S.
...and:
The data of Morales et al. for bladder cancer in a Taiwanese population has been graphed. The arsenic concentration is in μg/L, and the y-axis is lifetime probability of bladder cancer. The solid line is the best-fitting linear model::


Which brings us back to Dr. Honeycutt with the TCEQ:
USEPA used lung and bladder mortality data from Morales et al. (2000) for the dose-response assessment for the final draft SFo.  Morales et al. (2000) uses these mortality data to calculate standardized mortality ratios (SMRs) and notes,
  • “Although the computed SMRs display a large amount of noise, there appear to be higher SMRs at high exposure levels compared to exposures in the lower range, especially for bladder and lung cancer.”
Dr. Honeycutt responds:
To say that there is “noise” in the SMRs over the eight exposure categories is an understatement. 
Dose-response is the cornerstone of toxicology, but the lung and bladder mortality data (SMRs) from Morales et al. provide a poor basis for dose-response assessment as a dose-response is not apparent and not monotonic. 
Breaking the data down into the form of age-specific person-years at risk and cancer deaths does not improve the basis for dose-response assessment; it only obscures the lack of a good dose-response which is readily apparent from examination of the SMRs.

I have whipped this dead horse on the Slope Factor as much as I can.  Let's look at it another way.  Do we see the number of bladder cancers estimated by the Slope Factor derived from the Morales et al. data?

I addressed this once before in a previous post.  I'll do it again with a bit of a different spin.


Next Post: Arsenic in Rice: Part 12 - Look No Closer Than Your Own Backyard