Showing posts with label risk. Show all posts

Sunday, March 17, 2024

Vaccines for COVID-19: Censorship or Misrepresentation of the Data - Part 2

 In their rebuttal to Springer Nature Research Integrity Support over the decision to retract their paper "COVID-19 mRNA Vaccines: Lessons Learned from the Registrational Trials and Global Vaccination Campaign"...


...the authors state emphatically that the eight claims made in support of retraction are "false, misleading, and unsupported by evidence." In my previous post I argued in support of one of the claims, number 2 for Figure 5, showing how they were misleading in showing the data comparing adverse effects from the influenza vaccine when compared to the COVID-19 vaccine.

That was misleading, this next one is just downright inexcusable for an author who has an MPH as well as assert that they have an "understanding of epidemiological principles, methods and procedures, [and] how to place quantitative analyses in context.

I have the MPH but I don't claim to have the understanding that they claim to have. Again, I may be wrong here, but I'll show my work as to why I think they are incorrect and the claim for retraction is valid.

Claim Number 3: "Kersjes claim: The article states that the Pfizer COVID-19 vaccine saved two lives and caused 27 deaths per 100,000 vaccinations, and the Moderna vaccine saved 3.9 lives and caused 10.8 deaths per 100,000 vaccinations, though there does not appear to be convincing evidence for this claim."

The authors state "The calculation of number of lives saved per 100K vaccinations was in fact based on generous assumptions of benefit, utilizing data from the relatively healthy population recruited for the Pfizer trial. It was also based on conservative assumptions of risk based on the Fenton analysis of UK Yellow Card data."

The paper states:
It is imperative to carefully weigh all potential risks associated with the COVID-19 mRNA products. Should substantial harms be linked to their use, the perceived “reward” conveyed by the NNV would necessitate a re-appraisal. For example, assuming an NNV of 119 and an IFR of 0.23% (both conservative estimates), approximately 52,000 vaccinations would be needed to prevent one COVID-19-related death. Thus, for the BNT162b2 injection, a generous estimate would be two lives saved from COVID-19 for every 100,000 courses of the biological. Given the evidence of trial misconduct and data integrity problems (see next section), we conjecture that this estimate is an “upper bound”, and therefore the true benefit is likely to be much lower. Regarding potential harms, assuming 30% false-positive reports and a moderate under-reporting factor of 21, we calculate a risk of 27 deaths per 100,000 doses of BNT162b2. Thus, applying these reasonable, conservative assumptions, the estimated harms of the COVID-19 mRNA vaccines greatly outweigh the rewards: for every life saved, there were nearly 14 times more deaths caused by the modified mRNA injections (for details, see Appendix 2).
The authors contend that for every 100,000 doses of the vaccine, 27 will die because of the vaccine and only 2 out of those 100,000 vaccinated will be saved from COVID-19.

This was "clearly explained and delineated in Appendix 2." 
Thus, comparing the benefits to harms, at least 5 times more lives are lost than saved by the full course of Pfizer mRNA vaccinations.

At the time of the writing of their paper, there was, and still is, data collected by numerous reputable sources that would show this calculation to be wrong. That is, it does not match what we see. Even if the authors want to claim that actual deaths are kept from us, it would be difficult to accept that all these different government bodies who collect data were all in on keeping the data from us.

March 27, 2023 the UK Office for National Statistics writes

Several studies have reported associations between coronavirus (COVID-19) vaccination and risk of cardiac diseases, especially in young people; we assessed the impact of COVID-19 vaccination and positive SARS-CoV-2 tests on the risk of cardiac and all-cause mortality in young people (aged 12 to 29 years) in England using a self-controlled case series design.

There was no significant increase in cardiac or all-cause mortality in the 12 weeks following COVID-19 vaccination compared with more than 12 weeks after any dose for the study population as a whole.

They did find:

 According to the statistical model, 11 out of the 15 cardiac deaths in young women that occurred within 12 weeks of a first dose of a non-mRNA vaccine were likely to be linked to the vaccine; this corresponds to 6 cardiac-related deaths per 100,000 females vaccinated with at least a first dose of a non-mRNA vaccine.

Only females and only females within this age group based on reports of elevated risk of cardiac disease in young people. 


The CDC writes:

To assess mortality not associated with COVID-19 (non–COVID-19 mortality) after COVID-19 vaccination in a general population setting, a cohort study was conducted during December 2020–July 2021 among approximately 11 million persons enrolled in seven Vaccine Safety Datalink (VSD) sites.§ After standardizing mortality rates by age and sex, this study found that COVID-19 vaccine recipients had lower non–COVID-19 mortality than did unvaccinated persons. After adjusting for demographic characteristics and VSD site, this study found that adjusted relative risk (aRR) of non–COVID-19 mortality for the Pfizer-BioNTech vaccine was 0.41 (95% confidence interval [CI] = 0.38–0.44) after dose 1 and 0.34 (95% CI = 0.33–0.36) after dose 2. The aRRs of non–COVID-19 mortality for the Moderna vaccine were 0.34 (95% CI = 0.32–0.37) after dose 1 and 0.31 (95% CI = 0.30–0.33) after dose 2. The aRR after receipt of the Janssen vaccine was 0.54 (95% CI = 0.49–0.59).

Concluding: 

There is no increased risk for mortality among COVID-19 vaccine recipients. This finding reinforces the safety profile of currently approved COVID-19 vaccines in the United States.


The Lancet, June 2022, in a paper titled "Safety of mRNA vaccines administered during the initial 6 months of the US COVID-19 vaccination programme: an observational study of reports to the Vaccine Adverse Event Reporting System and v-safe" writes:

During the study period, 298 792 852 doses of mRNA vaccines were administered in the USA. VAERS processed 340 522 reports: 313 499 (92·1%) were non-serious, 22 527 (6·6%) were serious (non-death), and 4496 (1·3%) were deaths. The following tables breakdown what they found:


These three credible sources all show a very different risk outcome "of 27 deaths per 100,000 doses of BNT162b2." Reality shows us differently and that reality had to have been known to the authors since they are very clear on how their paper was extensively cited paper with 293 references (average paper has 30)"

That deals with the deaths they state as a risk of getting the vaccination. They also make a claim that "for the BNT162b2 injection, a generous estimate would be two lives saved from COVID-19 for every 100,000 courses of the biological."

This means - if I am reading it correctly - that their risk calculation projects only two lives saved per vaccinated individual. This means that for all intents and purposes the vaccine does nothing to save lives. Which means that we should see the roughly same amount of deaths from COVID-19 between those vaccinated and those not vaccinated. The author's write "approximately 52,000 vaccinations would be needed to prevent one COVID-19-related death."

That's their conclusion in glorious black and white pixels.

What does the data they had available to them show? Do we see the same results between vaccination and those not vaccinated. Let's do a Google search...  

Here is what the CDC reports:

Among persons aged ≥12 years, a total of 21,296,326 COVID-19 cases and 115,078 associated deaths were reported...from 24 U.S. jurisdictions....During all periods, average weekly age-standardized incidence and mortality were consistently higher among unvaccinated persons (ranges = 216.1–1,256.0 and 1.6–15.8, respectively) than among monovalent-only vaccine recipients (ranges = 86.4–487.7 and 0.3–1.4, respectively)...

If the authors of the retracted paper were correct, we would not see a weekly mortality that is lower for the vaccinated cohort (0.3–1.4) then the unvaccinated cohort (1.6–15.8). Once again, reality says something very different then the risk of lives saved they calculate and use to support their contention that the vaccine must be stopped.

The following was easily found data which shows that lives saved by the vaccine is considerable - or to use one of their words 'significant.' 

From the Washington State Department of Health (December 2023)


Scientific American (June 7, 2022):


Arizona Department of Health Services (6/7/2023)


When the authors write in their 2024 paper:

Thus, applying these reasonable, conservative assumptions, the estimated harms of the COVID-19 mRNA vaccines greatly outweigh the rewards: for every life saved, there were nearly 14 times more deaths caused by the modified mRNA injections (for details, see Appendix 2).

 They were either not being honest when they wrote this because they should have done a tiny modicum of research to see if their claim that their "reasonable, conservative assumptions [about] the estimated harms of the COVID-19 mRNA vaccines" actually matched reality, or they just don't care if the facts don't align with their feelings.

I am flabbergasted and dumbfounded as to how seven advanced degreed people and an " following an intensive review process that lasted several months and included multiple editors and reviewers," allowed this easily verifiable 'assumption' to get through. This alone should have thrown the paper into the rubbish bin.

Just because you do math and call it an 'assumption' does not excuse it from having to stand up to a tiny bit of credibility. It is another swing and a miss by those who don't like vaccines to scientifically prove why they are correct in their fear and dislike of this vaccine and/or all vaccines in general.

There is no censorship here. No violation of the Committee on Publication Ethics, No false, misleading, and unsupported by evidence claims by the Journal. Nothing arbitrary and capricious by Mr. Kersjes. This is a paper that makes claims that do not match reality, a reality that was available to all seven of the authors. Discounting all the research from all different parts of the globe by all different types of scientists, from many varied entities because it does not fit the conclusion you want - "a global moratorium on the modified mRNA products" - is bad science and they should be ashamed.

Their call for a moratorium "until all relevant questions pertaining to causality, residual DNA, and aberrant protein production are answered" is disingenuous because they will never allow their minds to be changed no matter what evidence they are shown.

Point goes to Mr. Kersjes, the retraction is warranted.

Note: I am becoming more and more convinced that peer reviewed is nothing more than a you scratch my back, I'll scratch yours. 


Saturday, January 4, 2014

If they only had a RCRA permit...Part 7

Does Exide pose an imminent or substantial risk to the community?

The DTSC ordered Exide to cease operation on April 24, 2013 claiming that:
16.1 In a letter dated March 1,2013, the SCAQMD advised Exide that the HRA submitted by Exide in January, 2013 indicates the Facility poses a maximum individual cancer risk (MICR) of 156 in one million for an offsite worker receptor about 300 meters northeast of the Facility (primarily arsenic).
In addition to compromised stormwater piping that Exide self-reported, the HRA values for cancer and non-cancer risk were also used by the DTSC to claim the need immediately shut down operations on the grounds that these two situations met the 25186.2 conditions for DTSC action "necessary to prevent or mitigate an imminent and substantial danger to the public health or safety or the environment."

Assuming that fixing the stormwater pipes corrects and mitigates that issue, does Exide pose a "maximum individual cancer risk" now or at the time of the DTSC notice to cease?

Looking at Exide's HRA:


You will notice that arsenic is the primary contributor to the risk number that was quantified.  In the RRP, Exide states:
Analysis of the HRA results and concurrent research determined that approximately 90 percent of the above-tabulated risks were due to emissions of arsenic from the Hard Lead Ventilation System stack and that the source of that arsenic was the “leakage” of blast furnace process exhaust from its primary ventilation system into hooding served by the Hard Lead Ventilation System.
So if both Exide and the DTSC conclude that arsenic is the chemical of concern for the risk, eliminating or reducing the amount of arsenic put into the air would reduce that risk.  Exide made some modifications to their equipment and went back into the original numbers and recalculated the theoretical risk:
Promptly after AQMD approval of the HRA on March 1, 2013, Exide designed an isolation door on the charge chute to the facility’s blast furnace to minimize the potential for blast furnace process exhaust gases to be drawn into the hooding served by the Hard Lead Ventilation System. This door system was permitted on March 28, 2013, and became operational on April 4, 2013. This door remains closed except to open briefly when charge material is actually being added to the furnace, only a small percentage of the time. (1)
What if instead of calculating a theoretical risk we could agree on something a little bit more quantitative and easier to understand.  Let's makes some assumptions and hold them as true.
  1. Exide should only be held accountable for the risk they pose over background.  That is, if you take Exide out of the equation and there is no difference in the amount of arsenic in the air, then the same risk is still present.  Exide is responsible for what they put in over that baseline.
  2. We will assume that the cancer potency the SCAQMD used for arsenic calculates a risk of 16 in one million for one nanogram per cubic meter of air.
  3. We will assume that the data collected by SCAQMD and reported in this document accurately reflects the actual amount of arsenic in the air near the Exide Vernon facility.
  4. We will assume that April 4, 2013 the facility was in operation with the new controls put in place and on April 24, 2013 operations ceased.
  5. We will assume that "the last week of June" is the 24th of June to indicate when Exide resumed operations.
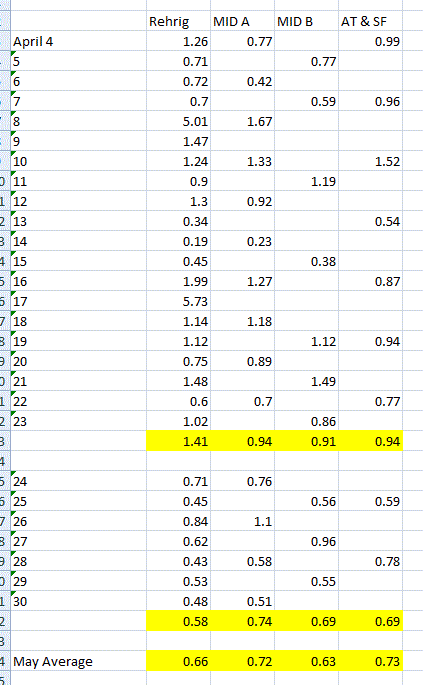
What I am going to do is calculate the average arsenic concentrations for each of the monitors based on the data presented in the SCAQMD document.  I am going to do this for the following periods:
  • April 4 to April 23 (new controls in place)
  • April 24 to June 23 (Exide not in operation - background)
  • June 24 to September 30th (Exide in operation last date for data provided)
I'll attach at the bottom of this post a gif of the spreadsheet I used to show the numbers that went into calculating these three time frames.  Here is what I came up with:


Based on where these monitors are placed...:

SCAQMD

According to SCAQMD's graph:

Source
The SCAQMD states that an average concentration of 1 nanogram per cubic meter equates to a lifetime cancer risk of 16.6 additional cancers.  I am not sure how they calculated that risk because it does not seem to jive with their written methodology for calculating cancer risk.

Based on California's 2003 "Air Toxics Hot Spots Program Risk Assessment Guidelines" the formula for calculating excess cancer risk look like this:

Appendix I - 4
The Inhalation Dose is based on this formula:

Appendix I - 2
Using their arsenic example for calculating the dose...:

Appendix I - 3

...I replaced 0,0015 micrograms with 0.0001 micrograms (1 nanogram).  The inhalation dose, based on 1 ng/m3 equals 3.8 x 10⁻⁸ mg/kg-day

To calculate the cancer risk per million, I replaced the Inhalation dose in the following example with the one calculated based on 1 ng/m3:

Appendix I-4
Based on an exposure of 1 ng/m3 the inhalation cancer risk is 0.45 chances per million.  That number is consistent with the cancer risk calculated by the WHO (0.66). [Cancer Potency checked 2011 most current]

So what does all this mean?

The DTSC gave an immediate cease operation order to Exide based on "imminent and substantial" harm to the public, claiming that:
Based on the Health Risk Assessment submitted to the SCAOMD, DTSC has determined that the Facility is operating its furnaces and its air pollution devices in a manner that is not sufficiently protective of human health and the environment, impacting as many as 110,000 residents in a large geographical area...
The HRA is a theoretical exposure calculated by Exide.  The graph SCAQMD put together represents actual concentrations of arsenic in the air. Before the order to cease operations was given by DTSC the SCAQMD had been collecting arsenic concentrations in the air in and around the Exide facility.

The SCAQMD calculated the highest monthly average of 3.33 ng/m3 from the off-site ATSF in May of 2012.  Assuming that all of that arsenic came from Exide - less the background I calculated (0.75) - this would give us a concentration of 2.58 ng/m3.

2.58 ng/m3 exposure equals a dose of 9.7 x 10⁻⁷.  With that dose, using the California HotSpot calculations, the excess cancer risk would be 11.67 in one million.

Would the highest amount calculated - before the modifications were made - be considered "imminent and substantial"?  That depends on how those two terms are defined.  Here is what the SCAQMD defines as "significant" in their Rule 1402:


Under the rule for air emissions, a cancer risk of 11.67 per one million would equal a risk of 0.11 per one hundred million and would not be considered "significant."

All of this information was available to the DTSC.  Heck if I can find it just using Google and a team of me, myself, and I, so could the DTSC.


Next Post: If they only had a RCRA permit...Part 8


__________________________


Thursday, January 2, 2014

If they only had a RCRA permit...Part 6

April 24, 2013:
A separate report submitted to the South Coast Air Quality Management District by Exide demonstrates that emissions from the facility operations pose a significant risk to the surrounding community.
That's the reason DTSC gave for telling Exide to "CEASE OPERATIONS EFFECTIVE APRIL 24, 2013."

That report, called a "Health Risk Assessment" was required by the SCAQMD and approved by them on March 1, 2013.  The next step was for Exide to make a public notice and develop a Risk Reduction Plan (RRP) which they did on August 28, 2013.

The DTSC, with the data from the HRA - along with the stormwater pipe issues - struck Exide with a cease operations mandate, which Exide challenged and won, starting operations back up on the last week of June, 2013.

That's a nice little history lesson you might be thinking, but what does it have to do with anything?

My question, at this point in time, regards harm or risk to the community around the Exide facility in Vernon.  The public wants it shut down and they are concerned for their health, as the Los Angeles Times wrote October 8, 2013:
Joe Gonzalez of Boyle Heights demanded of regulators: "How dare you come back here and ask us what we want. You're killing us...at what point does this become blatant racism?"
De León, who called the meeting, noted that "there are no Exides in Brentwood ... in Malibu."
"Are our children worth as much as any other child?"
 Does Exide present a "significant risk to the surrounding community."?

Well, I guess that would depend on how one defines the term "significant."

Here is how the SCAQMD defines it:

Rule 1402
What's a MICR?

Rule 1402
What did the DTSC find in the HRA that indicated a "significant risk level?"

Source

Based on the data from the HRA, Exide presents a "significant risk level" for workers but not for the folks who live in the area.

The problem with those numbers; 156 in one million and 22 in one million, is that they are theoretical and based on a model.  Here is what the formula looks like:

Rule 1402


The MICR that is calculated is an estimate based on the premise that the receptor will be exposed to the maximum emission rate every day for a particular length of time (70 years for a residence).  All of this predicated on a calculated annual average concentration for all the chemicals emitted.  Those numbers are then multiplied by this thing they call in California the "Cancer Potency."

Cancer Potency, or the Slope Factor is how we determine that one in a million risk.  I written about it a lot in previous posts.  It assumes a straight line dose-response where no exposure = no cancer and any exposure = risk of cancer.  Remember that SCAQMD graph on arsenic in and around the Exide facility?

Source
Look at the sentence at the bottom.  The cancer potency derived from the slope of the line calculates 16.6 additional lung cancers per million for one nanogram of arsenic in one cubic meter of air inhaled everyday for 70 years.

Let me remind you how small a nanogram is.
  • 1 milligram = 0.001 grams
  • 1 microgram = 0.000001 grams
  • 1 nonogram = 0.000000001 grams
I was curious to how that number was derived.  So I went to the Google and found a document from the World Health Organization (WHO) Regional Office for Europe, Copenhagen, Denmark.
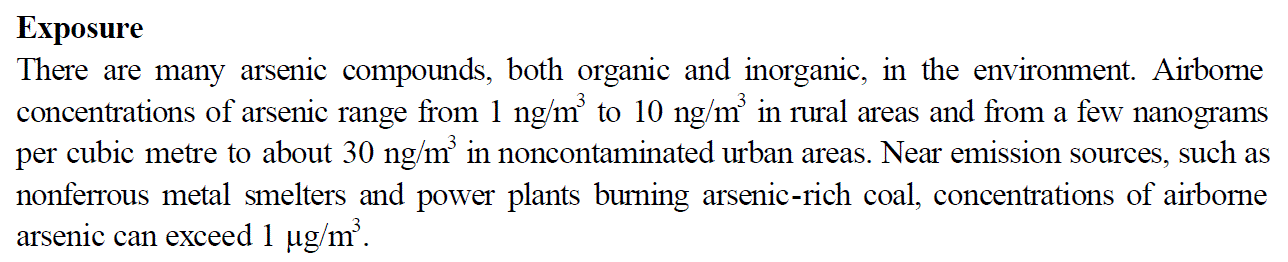
Neutron activation analysis (NAA) has a detection limit of 0.1 ng for total arsenic
Okay, I was wondering how they can detect with any degree of confidence to the nanogram level.

Then I read this in the WHO document:


WHO

Wait...if the breathing rate is 20 cubic meters a day, and the estimated lower end is 20 ng, that would mean in a rural area the average amount of arsenic in air is about 1 nanogram per cubic meter.  The SCAQMD graph shows the average arsenic in the SCAQMD area to be just above 0.5 nanograms.  I thought that seemed low when I first saw the graph, but now it does not jive with what the WHO states should be found in industrial areas.

But I digress.  Back to slope factors:

WHO
Okay, that's a bunch of words.  What does it all mean?

WHO

The WHO estimates about 2 additional cancers per nanogram while the SCAQMD estimates 16 per nanogram.  That's how this process of looking at cancer risk works.  It's kind-of-sort-of quantitative but how accurate it is in actually determining the real risk is anyone's guess.  So what ever model they use, or data they depend on, once accepted becomes the way it is calculated.  They hope it reflects reality, but really what they want is the most protective model they can "scientifically" support.  The WHO supports 0.66 ng/m3 for a one in one million risk while California supports about 0.06 ng/m3 for the same risk.  Which one is correct?

As I have said before, this is how we do it, this is all we got, so...if you can support your slope factor then I will need to accept your estimated cancer risk.

The problem I have with this as it relates to Exide is that the DTSC used this calculated risk to meet the definition of "significant" which they then used as the reason to tell Exide to cease operation.

That's not what the estimate of risk calculated in the HRA was to be used for, and somebody at the DTSC should have known that.

Those values calculated by Exide and reported in the HRA are used to determine where effort needs to be placed in terms of controls.  This is done through the submission of a Risk Reduction Plan (RRP)

DTSC used those numbers claiming that they required the operation cease to "prevent or mitigate the substantial danger pursuant to Health and Safety Code Section 25186.2."
25186.2.  The department may temporarily suspend any permit, registration or certificate issued pursuant to this chapter prior to any hearing if the department determines that the action is necessary to prevent or mitigate an imminent and substantial danger to the public health or safety or the environment.
I went looking for California's definition of "imminent" in the Health & Safety Code
113810.  "Imminent health hazard" means a significant threat or danger to health that is considered to exist when there is evidence sufficient to show that a product, practice, circumstance, or event creates a situation that can cause food infection, food intoxication, disease transmission, vermin infestation, or hazardous condition that requires immediate correction or cessation of operation to prevent injury, illness, or death.
I went looking for the definition of "substantial" in California and this is what I found:
A substantial factor in causing harm is a factor that a reasonable person would consider to have contributed to the harm. It must be more than a remote or trivial factor. It does not have to be the only cause of the harm.
Okay, so you get the picture.  I think DTSC misused the information in the HRA - theoretical risk - to claim actual risk.  Apparently so did a Judge and Exide was up and running the last week of June 2013.

Remember that graph from the SCAQMD?  They included the data along with the graph.

Back to my question.  Does Exide pose a significant or substantial risk to the community?  Or, looking at it another way, would the community see their health positively impacted if Exide were closed?

Next Post:  If they only had a RCRA permit...Part 7

.

Wednesday, January 1, 2014

If they only had a RCRA permit...Part 5

So the DTSC tells us in Exhibit 2 that they accept "a cumulative risk that does not exceed a one in one million (10-6) for cancer risk."

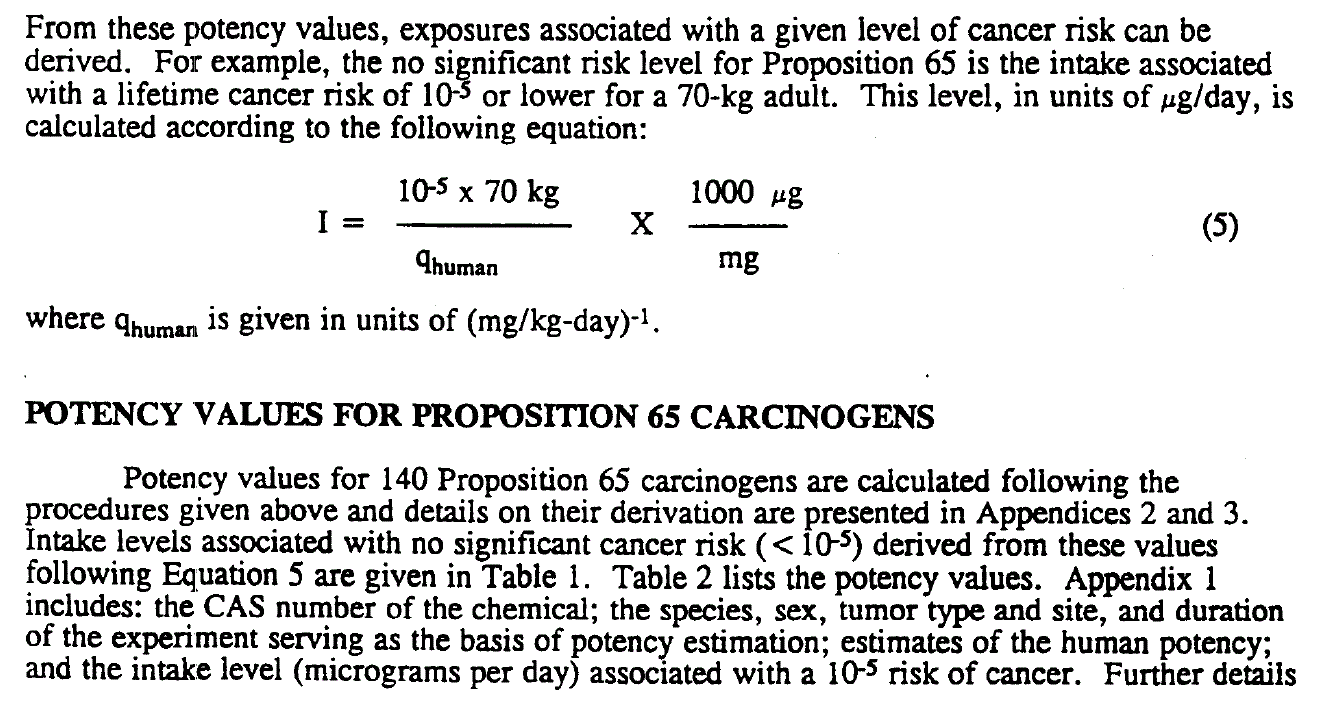
That did not sit right with me.  I wrote about California and how it calculates the slope factor for carcinogens and how it applies to the Proposition 65 notification requirements.  So I went about looking for that document.  And I found it:

Page 3
So DTSC accepts a 10-6 cumulative risk except when they accept a 10-5 cancer risk. This is one of the main problems in establishing risk.  Sometimes one in a million is okay, sometimes one in ten thousand is acceptable.

Okay, okay, I know what you are thinking.  The SCAQMD found a residential cancer risk of 22 in one million to the nearest residential receptor.  That's a 2.2 to the 10-5 risk and that's over one in 100,000.

Yeah, okay, that creates an increase risk - theoretical mind you - but a risk.  Not sure that 2.2 x 10⁻⁵ constitutes "an imminent and substantial danger to the public health or safety or the environment" though, even if you include the leaky stormwater pipes.

My question is, at this point in the discussion, does the arsenic emitted from Exide put the community at an imminent and substantial danger?  Remember our three intrepid reports at the Los Angeles Times?  Here is what they wrote about this risk:
In March, the South Coast Air Quality Management District reported that arsenic emissions from the plant created an elevated risk of cancer for as many as 110,000 people in an area stretching from Boyle Heights to Huntington Park.
I wonder where they got that number?  Oh, that's what the DTSC claims in Exhibit 2 of their justification to order Exide to halt operations:
18. Based on the Health Risk Assessment submitted to the SCAOMD, DTSC has determined that the Facility is operating its furnaces and its air pollution devices in a manner that is not sufficiently protective of human health and the environment, impacting as many as 110,000 residents in a large geographical area that includes portions of Vernon, Maywood, Huntington Park, Commerce, Boyle Heights and unincorporated areas of east Los Angeles. The predominant contributor to both chronic and acute cancer risk and non-cancer hazard is arsenic emissions from the Facility, with the primary human organs that are harmed are the cardiovascular system, central nervous system, developmental system, respiratory system and skin.
What this tells me is that the Exide facility in Vernon, California is pumping into the air enough arsenic to harm 110,000 people, causing cancer and affecting their cardiovascular system, central nervous system, developmental system, respiratory system and skin!

So...what did the SCAQMD find regarding arsenic and Exide?  Let's look at this graphic first:

Page 2 of the report
Before I get into the details of what is going on, I want you to look closely at this graphic paying particular attention to the "y" axis.  Do this while repeating "and non-cancer hazard is arsenic emissions from the Facility, with the primary human organs that are harmed are [sic] the cardiovascular system, central nervous system, developmental system, respiratory system and skin."

If you have read any of my other posts you will understand why this one bugs me.  Do you see how much arsenic was detected in the air around the facility?  Not milligrams (1,000th of a gram), not micrograms (1,000,000th of a gram) but nanograms - 1,000,000,000th of a gram.

Yeppers, that's what we now look at for arsenic in the air.  Nanograms per cubic meter.  So my next question will be, does less than 3.5 nanogram per cubic meter (the highest amount shown on the graph) present an "imminent and substantial danger?"

Remember those loud and angry folks yelling “Shut it down! Shut it down!”?  Those folks look to the DTSC for an answer.  They look to us scientists, toxicologists, experts for an answer to their number one concern "are we being harmed?"  And the DTSC gives them this:

Based on an average of about 2 nanograms of arsenic in each cubic meter of air, Exide is impacting "as many as 110,000 residents."  And "the predominant contributor to both chronic and acute cancer risk and non-cancer hazard is arsenic emissions from the Facility, with the primary human organs that are harmed are the cardiovascular system, central nervous system, developmental system, respiratory system and skin."

Is that an accurate representation of the risk these residence are encountering?


If they only had a RCRA permit...Part 6

.

Friday, October 26, 2012

Arsenic in Rice: Part 17 - The Ethical Considerations of a Threshold

Consumer Reports writes:
Consumers Union, the advocacy arm of Consumer Reports, urged the FDA to set a 3 ppb limit for total arsenic in apple and grape juice.
They are advocating for that level, which would then also be used for rice:
Using the 5-ppb [New Jersey] standard in our study, we found that a single serving of some rices could give an average adult almost one and a half times the inorganic arsenic he or she would get from a whole day’s consumption of water, about 1 liter. (CR)
Consumer Reports is advocating for a line to be drawn.  On one side the product will be "safe" - or - not  "troubling," "worrisome," "cause for concern," or "potentially harmful."  The question that needs to be asked is what will rice and apple juice that falls on the other side - more than 3 ppb - be called?


That's a question that seems to get brushed aside or, most likely, not even considered.  And here is where the ethical considerations of a threshold must be taken into consideration.

The reason that New Jersey decided that 5 ppb was "safe" for their water was because they could not effectively treat the water to anything below that.  Remember, their law demands a one in one million risk which means that the water would need to be treated to 0.003 ppb.  Not only is that not possible to treat down to, it is also not possible to analyze with any degree of precision and accuracy.

So New Jersey settled on 5 ppb as being reasonably able to attain:
This determination comports with the NJSDWA mandate to establish the MCL at the most protective level within the constraints of medical, scientific and technological feasibility. (NJ)
But that threshold is for water.  We can "waste" water if it cannot be treated, use it for non-consumption purposes.  That treatment option is not available for apple juice and rice that exceeds the threshold of 3 ppb.  So what would happen to it?  Would it need to be destroyed?  And if so, would the "wasting" of that apple juice, or more specifically rice, that contains 4 ppb inorganic arsenic be ethical?

First, let's settle on what I mean by "ethical":
Ethics refers to well-founded standards of right and wrong that prescribe what humans ought to do, usually in terms of rights, obligations, benefits to society, fairness, or specific virtues. (1)
The ethical consideration rears its ugly head when you draw that line in the sand.  If Consumer Reports wants a 3 ppb standard, what will be done with rice and apple juice that is found to contain 4 ppb?

If 3 ppb is "safe" then exceeding that number - appearing on the other side of that line is...what?
  • We are not talking about water here.  We are talking about a food.  You cannot treat rice or apple juice that is found to contain 4 ppb of inorganic arsenic, so what do you do with it?
  • Well we could blend it to dilute the total to below the 3 ppb - you know, the solution to pollution is dilution approach.  But that assumes that we have the capacity to store and blend this volume.
  • We could just dispose of it, but that means that we take that rice out of the food supply thereby denying rice to citizens that can no longer afford it.  Economics 101 in play: supply and demand sets the price,
  • We stop growing rice and apples in areas where the arsenic shows up in the samples.  Sounds good.  But you can't just plant an apple tree and start producing apples - it takes a long time to grow..  Nor can you grow rice anywhere - it take access to a lot of water.  Besides, look at the numbers for both apple juice and rice.  Arsenic is EVERYWHERE and in EVERY sample. It is ubiquitous with these two products because it is an element and it is in the water and soil cycle (see my previous post).
Well, that leaves us then with this.
  • We could give it to poor people or starving people.  That's a better alternative for them.  If you are hungry, what difference does it make?  And in areas where food is short, those folks will die from starvation long before bladder cancer ever manifests itself.
If you draw a line in the sand at some ppb, you either dilute it, waste it, or give it to others when that threshold is exceeded.

You see the problem now with a line in the sand?  That line had better be bullet-proof or the ethical considerations that will come into play will rear their ugly head.  If you say 3 ppb is "safe" then wasting rice and apple juice when it contains 4 ppb will raise the cost of these two items and take them out of being consumed.  We can live without apple juice, but rice?

If you say that 4 ppb is not bad enough to waste, then where do you draw the line as to when it must be wasted?  And who gets to consume the 4 ppb product?  Do wealthy people get to eat the 3 ppb and less while the poor and hungry get the above threshold product?  Would that be fair?

Is that ethical?  Is that what we ought to do?

What will the rice and apple juice that exceeds the "3 ppb limit" be classified as?  Consumer Reports calls rice above 5 ppb "troubling," "worrisome," "cause for concern," or "potentially harmful."  If they push for a 3 ppb limit, as they are advocating for apple juice, then how can they justify a 5 ppb limit for rice?  Rice will therefore have to also meet the 3 ppb limit per serving to be "safe."

Here is what I want Consumer Reports to respond to:
  1. What will rice and apple juice be considered if it exceeds the 3 ppb limit they urge the FDA to set?
  2. What must be done to rice and apple juice that exceeds this threshold of 3 ppb?
  3. Can rice and apple juice that exceeds 3 ppb be given to starving people and/or the poor, and, if so, how is that ethical?
And my final question:
  • If exceeding the threshold is considered "potentially harmful" or to increase risk, how can we ethically allow anyone to consume this rice and apple juice?
The answer is you can't. Once you draw a line in the sand, anything that appears on the other side must be the opposite of what you want.  Safe: Unsafe, Healthy: Unhealthy, Toxic: Non-Toxic,  Okay: Not Okay, Good: Bad.

It is one or the other, it cannot be both.

So I'll end with this:

If you are going to draw a line in the sand, that line better represent a real risk if you step over it.  Does stepping over a 3 ppb limit represent a real risk?  Does eating a 1/4 cup serving of rice with 9.6 ppb inorganic arsenic represent a real risk?  If it does, then it is "potentially harmful."  If it does not, then it is safe.

It cannot be both.  This is why we must choose a threshold that represents a real potential for harm.  When you do, those ethical considerations become much more manageable when you exceed the threshold. We have an obligation to protect public health.  We have an obligation to feed people.  We have an obligation to look at the data and make sound decisions when setting a threshold of what is, and is not "safe."


Part 17 - Creating a Needless Concern.

.

Monday, October 22, 2012

Arsenic in Rice: Part 16 - Rice Eaters and Bladder Cancer

Consumer Reports tells their readers:
Our resulting analysis of 3,633 study participants found that on average, people who reported eating one rice food item had total urinary arsenic levels 44 percent greater than those who had not, and people who reported consuming two or more rice products had levels 70 percent higher than those who had no rice.
This leads them to view the arsenic they detected in food products as such:
“Despite our taking into account other common sources of arsenic, and no matter which way we sliced the data, we see a very strong association between rice consumption and arsenic exposure,” says Stahlhut, who along with Navas-Acien led a similar analysis of NHANES data for our January 2012 article on arsenic in juice. That analysis found that study participants who reported drinking apple or grape juice had total urinary arsenic levels that were on average nearly 20 percent higher than those who didn't.
 Which leads them to this conclusion:
Consumers Union, the advocacy arm of Consumer Reports, urged the FDA to set a 3 ppb limit for total arsenic in apple and grape juice.
I am going to come back to that...but right now we still need to look at what we know so far.
  • Urinary arsenic concentrations give a good biomarker of the absorbed dose of arsenic, since about 70% is excreted in the urine. (AJE)
  • Rice eaters had arsenic levels that were 44 percent greater than those that do not consume rice. (CR)
  • The average amount of rice consumed is one cup. (EHP)
  • Consumer reports measured the amount of inorganic arsenic in one serving of rice and found the highest level to be 9.6 μg per 1/4 cup. (CR)
In my last post I attempted to show what is in play:
  • ...if a 1/4 cup serving size that exceeds the New Jersey drinking water standard of 5 ppb is considered by Consumer Reports to be "troubling," "worrisome," "cause for concern," or "potentially harmful." 
  • ....consuming one full cup of this rice must therefore result in four times more "troubling," "worrisome," "cause for concern," or "potentially harmful."
In all my previous posts I have tried to show that "troubling," "worrisome," "cause for concern," or "potentially harmful," that results from consuming 1/4 cup of rice that exceeds the New Jersey drinking water standard of 5 ppb for arsenic must be because of some risk of harm.

Because Consumer Reports sees harm if a serving is above 5 ppb, that harm must therefore be based on bladder cancer since that is what the NRC based the slope factor on used to support New Jersey's 5 ppb drinking water standard.

And because bladder cancer is also what IRIS is using for the Cancer Slope Factor - potency - they propose for arsenic, exceeding any number above "0" for arsenic increase the risk of bladder cancer.  New Jersey accepts a one in one million risk as acceptable which means 0.003 μg/L would be considered "safe."  Understanding reality, NJ set on a limit of 5 μg/L as acceptable based on the ability to treat the water as well as accurately test for an amount that low.  Therefore 0.003 μg/L "safe" became "safe" at 5 μg/L.

I then looked at urinary total arsenic that was reported by the CDC.  This led me to write in my last post:
So...if Mexican Americans and Asians consume more rice than Whites...and rice eaters have more urinary total arsenic than non-rice eaters...and the Cancer Slope Factor assume a potency whereby consuming more increase the risk harm...and that potency was used to that justify the New Jersey drinking water level of 5 ppb...and that Cancer Slope Factor, now proposed by the IRIS, is based on bladder cancer in woman...
Which I concluded with this:
...we would, therefore, expect to see more bladder cancer in Mexican Americans and Asians, especially in women...shouldn't we?
I want to stress here that all of my sources are the same sources as used by Consumer Reports and their experts.  They are all from reputable sources.  I am looking at the same data, facts, and figures that they look at and I don not see "troubling," "worrisome," "cause for concern," or "potentially harmful," for any of the rice they tested.

We are missing a lot, and I do mean a lot, of data to conclude "troubling," "worrisome," "cause for concern," or "potentially harmful," when exceeding 5 ppb per serving up to a maximum of 10 ppb.

If rice eaters have more urinary total arsenic then non-rice eaters, should we see more bladder cancer in those groups that consume rice on a daily basis?  So back to this question I posed:
...we would, therefore, expect to see more bladder cancer in Mexican Americans and Asians, especially in women...shouldn't we?
I went to the National Cancer Institute and looked up the data on bladder cancer from the Surveillance and Epidemiology and End Result (SEER) database.  Here is what they say:

Source

Now, with those estimate numbers in mind, let's look at what the EPA's IRIS is basing the proposed arsenic Cancer Slope Factor on:

2010 Draft IRIS Page 150-151


The EPA is proposing a Cancer Slope Factor on women's risk for bladder cancer.  This means that women appear to be more susceptible to the harm of bladder cancer from exposure to arsenic.  The "potency" of arsenic as a bladder cancer carcinogen is based on women and bladder cancer.  All things considered, when consuming a cup of rice, women and men receive the same dose of arsenic.  Same with drinking water.  There is a slight difference in urinary total arsenic between men and women.

CDC

If women are more susceptible to bladder cancer - the life-time risk - then wouldn't we see a higher incidence in women since consumption of arsenic seems to be the same?  That Cancer Slope Factor is derived from a line drawn through data points that looked at arsenic dose and incidence of cancer.  It assumes that there is a linear relationship between what was seen at high doses (the Morales data) and what should - theoretically - be seen at low doses.  It assumes a line going all the way to zero.  Zero dose, Zero risk of bladder cancer.

Let's look at those numbers in terms of an incidence rate for bladder cancer:

Source
EPA's proposed IRIS Cancer Slope Factor assumes a "safe" concentration of arsenic for a risk of one in 10,000 to be 0.14 μg/L (which is based on a consumption of 2 liters of drinking water per day).

Let's look at the incidence of bladder cancer in rice eaters.  Notice how Asians and Hispanics, two groups we know consume rice, have lower bladder cancer incidence than whites for both men and women.

I don't know...the numbers just don't support the theoretical potency for arsenic and bladder cancer the EPA is proposing.  Dr. Honneycutt with the TCEQ elaborates the same observation:
For bladder cancer alone, the incidence risk calculated by USEPA based on final draft values for males/females is 3.1E-04 per μg/L. Therefore, based on 2 μg/L as an average drinking water concentration, the estimated bladder cancer risk for the US population would be 6.2 per 10,000 or 62 per 100,000. However, the actual occurrence of bladder cancer in the US is about 23 cases per 100,000 (males/females combined). It would take 3 times the actual bladder cancer incidence for US males/females combined to even make possible the 62 cases per 100,000 estimated due to arsenic exposure from drinking water alone. Thus, the incidence risk calculated by USEPA final draft values for bladder cancer appears to be inaccurate and overly conservative. (emphasis mine)
Which brings us to this point.

If the theoretical Cancer Slope Factor is based on bladder cancer, and the incidence of bladder cancer does not match the theoretical risk being calculated, should we accept the theoretical risk as the basis for determining a "safe" threshold or for "establishing health criteria?"

If that Cancer Slope Factor proposed by EPA does not estimate the bladder cancer risk correctly, exceeding the New Jersey 5 ppb threshold for a 1/4 serving of rice will not be "troubling," "worrisome," "cause for concern," or "potentially harmful."

And if that's true, advocating for a "3 ppb limit for total arsenic in apple and grape juice" - which would be carried over for rice - is not warranted.

That's an important point to acknowledge.  It is the whole reason I spend time writing these posts.  If we are going to draw a line in the sand and claim "safe" on one side, then we will need to address what will it mean for the products that have concentrations above that threshold and fall on the other side of the line?


Not only does the science behind toxicology demand that we get this right, there are ethical considerations that need to be made as well.


Next Post: Arsenic in Rice: Part 17 - The Ethical Considerations of a Threshold


.

Sunday, October 21, 2012

Arsenic in Rice: Part 15 - Urine From Rice Eaters

Continuing on...

Here is what we have been told so far:
  • Urinary arsenic concentrations give a good biomarker of the absorbed dose of arsenic, since about 70% is excreted in the urine. (AJE)
  • Rice eaters had arsenic levels that were 44 percent greater than those that do not consume rice. (CR)
  • The average amount of rice consumed is one cup. (EHP)
  • Consumer reports measured the amount of inorganic arsenic in one serving of rice and found the highest level to be 9.6 μg per 1/4 cup. (CR)
For those of you who are interested in how consumer Reports came up with that value of 9.6 μg per 1/4 cup, I am going to assume it was based on this methodology.  Consumer Reports "PDF with complete details of our test results" lists the concentration of inorganic arsenic as a part per billion (ppb).

PDF with complete details of our test results
214 ppb is most likely from a weight to weight analysis.  So in this case there were found to be 214 μg of inorganic arsenic per kilogram (kg) of rice.  Consumer Reports calculates a 1/4 cup serving size to contain 45 grams of rice:


Using some algebra...if one kg of rice contains 214 μg of inorganic arsenic, 45 grams of rice will contain 9.63 μg, and that concurs with what Consumer Reports shows in their report:


So the next question will be, what amount of inorganic arsenic do folks actually consume?  This is where it gets a bit tricky.  It seems that the results on urinary arsenic is for total arsenic.  We want to look at inorganic arsenic, the form of arsenic that may contribute to bladder cancer.

With that in mind, let's assume that the total urinary arsenic is inorganic arsenic.  Here is what we find, according to the Centers for Disease Control (CDC)

CDC
Consumer Reports tells us that "people who ate rice had arsenic levels that were 44 percent greater than those who had not," and "certain ethnic groups were more highly affected, including Mexicans, other Hispanics, and a broad category that includes Asians."

You can see that Mexican Americans have a higher mean urinary total arsenic than non-Hispanic whites, but non-Hispanic blacks are even higher.  What we don't have is data on Asians.  Now, based on all of this, rice eaters consume more arsenic than non-rice eaters.  This is confirmed by the Dartmouth study on children:
Results: The median total urinary arsenic concentration among children who reported consuming rice was 8.9 μg/L  compared with 5.5 μg/L among those who did not consume rice. 
That median is based on 1/4 cup of rice.  The Dartmouth researches also report:
After adjusting for potentially confounding factors, and restricting the study to participants who did not consume seafood in the preceding 24 hr, total urinary arsenic concentration increased 14.2% with each 0.25 cup increase in cooked rice consumption.
What we know now is that rice consumption is a potential source of arsenic exposure.

Assuming that the impact for rice and water on the total urinary arsenic is similar for an adult as it is for a child...and considering that the mean reported by the CDC is for both rice eaters and non-rice eaters, we can assume that a Mexican American eating one cup of rice would have approximately 15.8 μg/L urinary total arsenic. (9.29 x 1.142 = 10.6 X 1.142 = 12.1 x 1.142 = 13.8 x 1.142 = 15.8)

Dr. Smith tells us - based on the Mormon cohort research he cited:
Urinary arsenic concentrations give a good biomarker of the absorbed dose of arsenic, since about 70% is excreted in the urine.  Excretion of arsenic in urine as a function of exposure to arsenic in drinking water. (AJE
If the average amount of urine produced is 2 liters per day, a Mexican American consuming on average one cup of rice would therefore be consuming an absorbed dose of about 45 μg of total arsenic to produce 15.8 μg/L of total urinary arsenic.  ([45 * 0.70] / 2) = 15.8 μg/L

I assume my math and logic are both correct on this.

Point here is this.  If the total arsenic Consumer Reports found in the Martin Long Grain Brown Rice was 398 μg/Kg, consuming one cup of this rice would produce a total dose of  72 μg total arsenic.  If 70% of that is excreted in the urine as total arsenic, we would see 50.4 μg in the total urine produced in a day.  If the average amount of urine is 2 liters, this would equate to a urinary total arsenic concentration of about 25 μg/L.

What does all this math mean?  Look at it this way.  If Mexican Americans consume more rice than whites, and the average urinary total arsenic in a Mexican American is 9.29 μg/L, if Dr. Smith is correct and Urinary arsenic concentrations give a good biomarker of the absorbed dose of arsenic, since about 70% is excreted in the urine.  The exposure dose is about 28 μg for a person producing 2 liters of urine.  That's 28 μg from all sources.

Now that 70% excretion was calculate from drinking water.  It is possible that the majority of arsenic in the rice is excreted through the feces.  If that's the case, we can assume that this arsenic was not made available for harm (bladder cancer), which seems to be supported by the CDC data on rice eaters.

Since we do have evidence that rice eaters have more urinary total arsenic than non-rice eaters, we can ask the question, do those groups who are considered to consume more rice show a higher incidence of bladder cancer compared to those who do not.

Here is where that CDC report comes in handy.  It appears that Whites have lower urinary total arsenic than Mexican Americans and Blacks.  If , according to Dr. Smith's contention that "urinary arsenic concentrations give a good biomarker of the absorbed dose of arsenic, since about 70% is excreted in the urine," those with higher mean concentrations of urinary total arsenic must be consuming more food products with higher concentrations of arsenic.

Not sure about Blacks, but Mexican Americans were singled out by Consumer Reports as being rice eaters:
And certain ethnic groups were more highly affected, including Mexicans, other Hispanics, and a broad category that includes Asians.
We can assume that their higher urinary total arsenic must come from the consumption of rice.  And, if one cup is the average amount of rice consumed, that's a lot of arsenic consumed with the rice.  Remember that Consumer Reports looked at a rice serving size of 1/4 cup.

Which brings us back to "troubling," "worrisome," "cause for concern," or "potentially harmful."

You see - well at least as I see it - if a 1/4 cup serving size that exceeds the New Jersey drinking water standard of 5 ppb is considered by Consumer Reports to be "troubling," "worrisome," "cause for concern," or "potentially harmful," consuming one full cup of this rice must result in four times more "troubling," "worrisome," "cause for concern," or "potentially harmful."

As Consumer Reports sees it there will be harm if a serving is above 5 ppb.  That harm must therefore be based on bladder cancer since that is what the NRC based the slope factor on used to support New Jersey's 5 ppb drinking water standard.  Bladder cancer is also what IRIS is using for the Cancer Slope Factor - potency - they propose for arsenic.

So...if Mexican Americans and Asians consume more rice than Whites...and rice eaters have more urinary total arsenic than non-rice eaters...and the Cancer Slope Factor assume a potency whereby consuming more increase the risk harm...and that potency was used to that justify the New Jersey drinking water level of 5 ppb...and that Cancer Slope Factor, now proposed by the IRIS, is based on bladder cancer in woman...

...we would, therefore, expect to see more bladder cancer in Mexican Americans and Asians, especially in women...shouldn't we?

If those who consume rice have higher concentrations of urinary total arsenic, and there is a linear dose-response as the EPA's ATSDR contends, those who consume rice should show a higher bladder cancer incidence.

Drum roll please.....

Next post: Arsenic in Rice: Part 16 - Rice Eaters and Bladder Cancer


.

Friday, October 19, 2012

Arsenic in Rice: Part 14 - Give me a "P"...Arsenic in the Urine

If you thought 13 posts on the cancer Slope Factor was fun and interesting.  You are going to love this discussion on urine.

What do you get when you ask a bunch of Mormons to pee in a cup for five days?

You get some really good data (see footnote) on the correlation between urine arsenic and the arsenic in the drinking water they consumed.

That's going to be important in a little bit.  You see, when you read the Consumer Reports articles on arsenic in apple juice and rice you start to see a conclusion being pushed.  I can speculate as to why, but I am trying to make a case based solely on the data.  Speculation is the absence of that.  Nevertheless, you have to wonder about an agenda in play here, especially when you look into the work their subject matter experts have produced.

Case in point...here is what is quoted in Consumer Reports for arsenic in rice:
“We already know that high concentrations of arsenic in drinking water result in the highest known toxic substance disease risks from any environmental exposure,” says Allan Smith, M.D., Ph.D., a professor of epidemiology at the University of California, Berkeley. “So we should not be arguing to wait for years until we have results of epidemiologic studies at lower arsenic intake, such as from rice consumption, to take action.” His studies of arsenic in public water in Chile and Argentina helped show that it causes lung and bladder cancer and other diseases.
That Smith guy Consumer Reports uses as a subject matter expert, well he is one of the players in producing the data the NAS/NRC and New Jersey used to come up with the 5 ppb.

Source

...and his work is used all over the place in the 2010 draft IRIS toxicological review of inorganic arsenic.

Source
Here is what Dr. A. H. Smith states in the Consumer Reports article:
“So we should not be arguing to wait for years until we have results of epidemiologic studies at lower arsenic intake, such as from rice consumption, to take action.” 
No?  Instead we should base it on your data which in the draft IRIS document on arsenic we are told:
  • Weaknesses include that arsenic levels were not available at the individual source level, dose response information was not provided, and only limited individual smoking history information was available (i.e., participants were asked if they had smoked cigarettes over a 1-month period in 1990). [Page 49]
  • Weaknesses include that place of residence was determined from the death certificates, which relates to residence at the time of death, and the reliance on death certificates (potential diagnostic bias). Smoking, although considered unlikely by Smith et al. (2006), is a potential confounder for this study.
Okay...okay, my goal here is not to critique Dr. Smith's work, it is instead to show how certain statements, such as "troubling," "worrisome," "cause for concern," or "potentially harmful" are not supported by what we know about the 5 ppb threshold Consumer Reports is using to declare rice to not be "troubling," "worrisome," "cause for concern," or "potentially harmful."

I do want to look at Dr. Smith's statement that we "take action now instead of waiting for and epidemiologic studies at lower arsenic intake."  Dr. Smith is an E.  I am not an Epidemiologist (though I am staying at a Fairfield Inn in Alamogordo which is right next to a Holiday Inn Express as I write this, so....).

With that in mind, I will need to use other peoples work to make the case that the evidence before us does not show a need to "take action now" which would lead to this action:
Consumers Union believes a standard for arsenic should be set for rice.
After 13 posts, I hope I have shown how the current proposed Slope Factor that leads to a "safe" threshold of 5 ppb - which is used by New Jersey for drinking water - does not mean there is harm, or unnecessary risk, when consuming rice at up to 10 μg arsenic per serving.

Okay, you may be saying, ...but what about the fact that rice eaters have higher amounts of arsenic in their urine?  Huh?  What about that???  Doesn't Consumer Reports state:
People who ate rice had arsenic levels that were 44 percent greater than those who had not, according to our analysis of federal health data. And certain ethnic groups were more highly affected, including Mexicans, other Hispanics, and a broad category that includes Asians. (CR)
So let's run with that, shall we...

According to their subject matter expert, Dr. A. H. Smith:
Urinary arsenic concentrations give a good biomarker of the absorbed dose of arsenic, since about 70% is excreted in the urine.  Excretion of arsenic in urine as a function of exposure to arsenic in drinking water. (AJE
Here is what Consumer Reports tells us:
Researchers at the Dartmouth Children’s Environmental Health and Disease Prevention Research Center in late 2011 published a small but informative study that indicated consuming slightly more than a half-cup of cooked rice per day resulted in a significant increase in urinary arsenic levels, comparable to the effects of drinking a liter of water containing the federal maximum of 10 ppb arsenic. The authors say their results suggest “many people in the U.S. may be exposed to potentially harmful levels of arsenic through rice consumption.”
I went to the Dartmouth Children’s Environmental Health and Disease Prevention Research Center's web page and looked up everything they had on arsenic.  I cannot find anything dated in 2011, but what I did look at does not state anything like "many people in the U.S. may be exposed to potentially harmful levels of arsenic through rice consumption."  Here is what their research and papers state:
  • Despite these limitations, our findings suggest that rice is a potential source of arsenic exposure in U.S. children and highlight the need to better understand the health consequences of common levels of arsenic exposure early in life. (1)
  • Our study suggests that rice consumption is a potential source of arsenic exposure in U.S. children. (2)
  • There is some evidence that high levels of arsenic exposure during childhood are associated with neurobehavioral problems as well as cancer and lung disease later in life. However, further research is needed to understand the health effects of exposures like those observed in this study. (3)
I am not in any way shape or form implying that arsenic is not a health concern.  I am making an argument that the amount of arsenic reported to be found in rice sampled by Consumer Reports is not in any way shape or form "troubling," "worrisome," "cause for concern," or "potentially harmful," if it exceeds 5 μg per serving.

Continuing on...

Have I ever mentioned how glad I am to work for a University where I have access to their library...I looked up that Dartmouth report, where I read this:
Among the roughly one-quarter of Americans who report rice consumption, the average amount of rice consumed is approximately 1 cup of cooked rice per day
So here is what we know so far:
  • Urinary arsenic concentrations give a good biomarker of the absorbed dose of arsenic, since about 70% is excreted in the urine. 
  • Rice eaters had arsenic levels that were 44 percent greater than those that do not consume rice.
  • The average amount of rice consumed is one cup.
  • Consumer reports measured the amount of inorganic arsenic in one serving of rice and found the highest level to be 9.6 μg per 1/4 cup.
Looking closely at the urine...remember, science is fun...we can start to get an idea of how much inorganic arsenic is actually being consumed.  And, with that information we can ask the question do we see an increase in bladder cancer for those rice eaters compared to the general public as a whole?

The premise here is based on this:  If arsenic increases the risk of bladder cancer (which is what the Slope Factor is based on) then those who are exposed to more arsenic (rice eaters) would show more incidence of bladder cancer.

Let's see what the data shows....


Source: Calderon RL, Hudgens E, Le XC, et al. Excretion of arsenic in urine as a function of exposure to arsenic in drinking water. Environ Health Perspect 1999;107(8):663-667.

Next post: Arsenic in Rice: Part 15 - Urine From Rice Eaters


..