Showing posts with label IRIS. Show all posts

Sunday, October 21, 2012

Arsenic in Rice: Part 15 - Urine From Rice Eaters

Continuing on...

Here is what we have been told so far:
  • Urinary arsenic concentrations give a good biomarker of the absorbed dose of arsenic, since about 70% is excreted in the urine. (AJE)
  • Rice eaters had arsenic levels that were 44 percent greater than those that do not consume rice. (CR)
  • The average amount of rice consumed is one cup. (EHP)
  • Consumer reports measured the amount of inorganic arsenic in one serving of rice and found the highest level to be 9.6 μg per 1/4 cup. (CR)
For those of you who are interested in how consumer Reports came up with that value of 9.6 μg per 1/4 cup, I am going to assume it was based on this methodology.  Consumer Reports "PDF with complete details of our test results" lists the concentration of inorganic arsenic as a part per billion (ppb).

PDF with complete details of our test results
214 ppb is most likely from a weight to weight analysis.  So in this case there were found to be 214 μg of inorganic arsenic per kilogram (kg) of rice.  Consumer Reports calculates a 1/4 cup serving size to contain 45 grams of rice:


Using some algebra...if one kg of rice contains 214 μg of inorganic arsenic, 45 grams of rice will contain 9.63 μg, and that concurs with what Consumer Reports shows in their report:


So the next question will be, what amount of inorganic arsenic do folks actually consume?  This is where it gets a bit tricky.  It seems that the results on urinary arsenic is for total arsenic.  We want to look at inorganic arsenic, the form of arsenic that may contribute to bladder cancer.

With that in mind, let's assume that the total urinary arsenic is inorganic arsenic.  Here is what we find, according to the Centers for Disease Control (CDC)

CDC
Consumer Reports tells us that "people who ate rice had arsenic levels that were 44 percent greater than those who had not," and "certain ethnic groups were more highly affected, including Mexicans, other Hispanics, and a broad category that includes Asians."

You can see that Mexican Americans have a higher mean urinary total arsenic than non-Hispanic whites, but non-Hispanic blacks are even higher.  What we don't have is data on Asians.  Now, based on all of this, rice eaters consume more arsenic than non-rice eaters.  This is confirmed by the Dartmouth study on children:
Results: The median total urinary arsenic concentration among children who reported consuming rice was 8.9 μg/L  compared with 5.5 μg/L among those who did not consume rice. 
That median is based on 1/4 cup of rice.  The Dartmouth researches also report:
After adjusting for potentially confounding factors, and restricting the study to participants who did not consume seafood in the preceding 24 hr, total urinary arsenic concentration increased 14.2% with each 0.25 cup increase in cooked rice consumption.
What we know now is that rice consumption is a potential source of arsenic exposure.

Assuming that the impact for rice and water on the total urinary arsenic is similar for an adult as it is for a child...and considering that the mean reported by the CDC is for both rice eaters and non-rice eaters, we can assume that a Mexican American eating one cup of rice would have approximately 15.8 μg/L urinary total arsenic. (9.29 x 1.142 = 10.6 X 1.142 = 12.1 x 1.142 = 13.8 x 1.142 = 15.8)

Dr. Smith tells us - based on the Mormon cohort research he cited:
Urinary arsenic concentrations give a good biomarker of the absorbed dose of arsenic, since about 70% is excreted in the urine.  Excretion of arsenic in urine as a function of exposure to arsenic in drinking water. (AJE
If the average amount of urine produced is 2 liters per day, a Mexican American consuming on average one cup of rice would therefore be consuming an absorbed dose of about 45 μg of total arsenic to produce 15.8 μg/L of total urinary arsenic.  ([45 * 0.70] / 2) = 15.8 μg/L

I assume my math and logic are both correct on this.

Point here is this.  If the total arsenic Consumer Reports found in the Martin Long Grain Brown Rice was 398 μg/Kg, consuming one cup of this rice would produce a total dose of  72 μg total arsenic.  If 70% of that is excreted in the urine as total arsenic, we would see 50.4 μg in the total urine produced in a day.  If the average amount of urine is 2 liters, this would equate to a urinary total arsenic concentration of about 25 μg/L.

What does all this math mean?  Look at it this way.  If Mexican Americans consume more rice than whites, and the average urinary total arsenic in a Mexican American is 9.29 μg/L, if Dr. Smith is correct and Urinary arsenic concentrations give a good biomarker of the absorbed dose of arsenic, since about 70% is excreted in the urine.  The exposure dose is about 28 μg for a person producing 2 liters of urine.  That's 28 μg from all sources.

Now that 70% excretion was calculate from drinking water.  It is possible that the majority of arsenic in the rice is excreted through the feces.  If that's the case, we can assume that this arsenic was not made available for harm (bladder cancer), which seems to be supported by the CDC data on rice eaters.

Since we do have evidence that rice eaters have more urinary total arsenic than non-rice eaters, we can ask the question, do those groups who are considered to consume more rice show a higher incidence of bladder cancer compared to those who do not.

Here is where that CDC report comes in handy.  It appears that Whites have lower urinary total arsenic than Mexican Americans and Blacks.  If , according to Dr. Smith's contention that "urinary arsenic concentrations give a good biomarker of the absorbed dose of arsenic, since about 70% is excreted in the urine," those with higher mean concentrations of urinary total arsenic must be consuming more food products with higher concentrations of arsenic.

Not sure about Blacks, but Mexican Americans were singled out by Consumer Reports as being rice eaters:
And certain ethnic groups were more highly affected, including Mexicans, other Hispanics, and a broad category that includes Asians.
We can assume that their higher urinary total arsenic must come from the consumption of rice.  And, if one cup is the average amount of rice consumed, that's a lot of arsenic consumed with the rice.  Remember that Consumer Reports looked at a rice serving size of 1/4 cup.

Which brings us back to "troubling," "worrisome," "cause for concern," or "potentially harmful."

You see - well at least as I see it - if a 1/4 cup serving size that exceeds the New Jersey drinking water standard of 5 ppb is considered by Consumer Reports to be "troubling," "worrisome," "cause for concern," or "potentially harmful," consuming one full cup of this rice must result in four times more "troubling," "worrisome," "cause for concern," or "potentially harmful."

As Consumer Reports sees it there will be harm if a serving is above 5 ppb.  That harm must therefore be based on bladder cancer since that is what the NRC based the slope factor on used to support New Jersey's 5 ppb drinking water standard.  Bladder cancer is also what IRIS is using for the Cancer Slope Factor - potency - they propose for arsenic.

So...if Mexican Americans and Asians consume more rice than Whites...and rice eaters have more urinary total arsenic than non-rice eaters...and the Cancer Slope Factor assume a potency whereby consuming more increase the risk harm...and that potency was used to that justify the New Jersey drinking water level of 5 ppb...and that Cancer Slope Factor, now proposed by the IRIS, is based on bladder cancer in woman...

...we would, therefore, expect to see more bladder cancer in Mexican Americans and Asians, especially in women...shouldn't we?

If those who consume rice have higher concentrations of urinary total arsenic, and there is a linear dose-response as the EPA's ATSDR contends, those who consume rice should show a higher bladder cancer incidence.

Drum roll please.....

Next post: Arsenic in Rice: Part 16 - Rice Eaters and Bladder Cancer


.

Friday, October 19, 2012

Arsenic in Rice: Part 14 - Give me a "P"...Arsenic in the Urine

If you thought 13 posts on the cancer Slope Factor was fun and interesting.  You are going to love this discussion on urine.

What do you get when you ask a bunch of Mormons to pee in a cup for five days?

You get some really good data (see footnote) on the correlation between urine arsenic and the arsenic in the drinking water they consumed.

That's going to be important in a little bit.  You see, when you read the Consumer Reports articles on arsenic in apple juice and rice you start to see a conclusion being pushed.  I can speculate as to why, but I am trying to make a case based solely on the data.  Speculation is the absence of that.  Nevertheless, you have to wonder about an agenda in play here, especially when you look into the work their subject matter experts have produced.

Case in point...here is what is quoted in Consumer Reports for arsenic in rice:
“We already know that high concentrations of arsenic in drinking water result in the highest known toxic substance disease risks from any environmental exposure,” says Allan Smith, M.D., Ph.D., a professor of epidemiology at the University of California, Berkeley. “So we should not be arguing to wait for years until we have results of epidemiologic studies at lower arsenic intake, such as from rice consumption, to take action.” His studies of arsenic in public water in Chile and Argentina helped show that it causes lung and bladder cancer and other diseases.
That Smith guy Consumer Reports uses as a subject matter expert, well he is one of the players in producing the data the NAS/NRC and New Jersey used to come up with the 5 ppb.

Source

...and his work is used all over the place in the 2010 draft IRIS toxicological review of inorganic arsenic.

Source
Here is what Dr. A. H. Smith states in the Consumer Reports article:
“So we should not be arguing to wait for years until we have results of epidemiologic studies at lower arsenic intake, such as from rice consumption, to take action.” 
No?  Instead we should base it on your data which in the draft IRIS document on arsenic we are told:
  • Weaknesses include that arsenic levels were not available at the individual source level, dose response information was not provided, and only limited individual smoking history information was available (i.e., participants were asked if they had smoked cigarettes over a 1-month period in 1990). [Page 49]
  • Weaknesses include that place of residence was determined from the death certificates, which relates to residence at the time of death, and the reliance on death certificates (potential diagnostic bias). Smoking, although considered unlikely by Smith et al. (2006), is a potential confounder for this study.
Okay...okay, my goal here is not to critique Dr. Smith's work, it is instead to show how certain statements, such as "troubling," "worrisome," "cause for concern," or "potentially harmful" are not supported by what we know about the 5 ppb threshold Consumer Reports is using to declare rice to not be "troubling," "worrisome," "cause for concern," or "potentially harmful."

I do want to look at Dr. Smith's statement that we "take action now instead of waiting for and epidemiologic studies at lower arsenic intake."  Dr. Smith is an E.  I am not an Epidemiologist (though I am staying at a Fairfield Inn in Alamogordo which is right next to a Holiday Inn Express as I write this, so....).

With that in mind, I will need to use other peoples work to make the case that the evidence before us does not show a need to "take action now" which would lead to this action:
Consumers Union believes a standard for arsenic should be set for rice.
After 13 posts, I hope I have shown how the current proposed Slope Factor that leads to a "safe" threshold of 5 ppb - which is used by New Jersey for drinking water - does not mean there is harm, or unnecessary risk, when consuming rice at up to 10 μg arsenic per serving.

Okay, you may be saying, ...but what about the fact that rice eaters have higher amounts of arsenic in their urine?  Huh?  What about that???  Doesn't Consumer Reports state:
People who ate rice had arsenic levels that were 44 percent greater than those who had not, according to our analysis of federal health data. And certain ethnic groups were more highly affected, including Mexicans, other Hispanics, and a broad category that includes Asians. (CR)
So let's run with that, shall we...

According to their subject matter expert, Dr. A. H. Smith:
Urinary arsenic concentrations give a good biomarker of the absorbed dose of arsenic, since about 70% is excreted in the urine.  Excretion of arsenic in urine as a function of exposure to arsenic in drinking water. (AJE
Here is what Consumer Reports tells us:
Researchers at the Dartmouth Children’s Environmental Health and Disease Prevention Research Center in late 2011 published a small but informative study that indicated consuming slightly more than a half-cup of cooked rice per day resulted in a significant increase in urinary arsenic levels, comparable to the effects of drinking a liter of water containing the federal maximum of 10 ppb arsenic. The authors say their results suggest “many people in the U.S. may be exposed to potentially harmful levels of arsenic through rice consumption.”
I went to the Dartmouth Children’s Environmental Health and Disease Prevention Research Center's web page and looked up everything they had on arsenic.  I cannot find anything dated in 2011, but what I did look at does not state anything like "many people in the U.S. may be exposed to potentially harmful levels of arsenic through rice consumption."  Here is what their research and papers state:
  • Despite these limitations, our findings suggest that rice is a potential source of arsenic exposure in U.S. children and highlight the need to better understand the health consequences of common levels of arsenic exposure early in life. (1)
  • Our study suggests that rice consumption is a potential source of arsenic exposure in U.S. children. (2)
  • There is some evidence that high levels of arsenic exposure during childhood are associated with neurobehavioral problems as well as cancer and lung disease later in life. However, further research is needed to understand the health effects of exposures like those observed in this study. (3)
I am not in any way shape or form implying that arsenic is not a health concern.  I am making an argument that the amount of arsenic reported to be found in rice sampled by Consumer Reports is not in any way shape or form "troubling," "worrisome," "cause for concern," or "potentially harmful," if it exceeds 5 μg per serving.

Continuing on...

Have I ever mentioned how glad I am to work for a University where I have access to their library...I looked up that Dartmouth report, where I read this:
Among the roughly one-quarter of Americans who report rice consumption, the average amount of rice consumed is approximately 1 cup of cooked rice per day
So here is what we know so far:
  • Urinary arsenic concentrations give a good biomarker of the absorbed dose of arsenic, since about 70% is excreted in the urine. 
  • Rice eaters had arsenic levels that were 44 percent greater than those that do not consume rice.
  • The average amount of rice consumed is one cup.
  • Consumer reports measured the amount of inorganic arsenic in one serving of rice and found the highest level to be 9.6 μg per 1/4 cup.
Looking closely at the urine...remember, science is fun...we can start to get an idea of how much inorganic arsenic is actually being consumed.  And, with that information we can ask the question do we see an increase in bladder cancer for those rice eaters compared to the general public as a whole?

The premise here is based on this:  If arsenic increases the risk of bladder cancer (which is what the Slope Factor is based on) then those who are exposed to more arsenic (rice eaters) would show more incidence of bladder cancer.

Let's see what the data shows....


Source: Calderon RL, Hudgens E, Le XC, et al. Excretion of arsenic in urine as a function of exposure to arsenic in drinking water. Environ Health Perspect 1999;107(8):663-667.

Next post: Arsenic in Rice: Part 15 - Urine From Rice Eaters


..

Friday, October 5, 2012

Arsenic in Rice: Part 13 - It's There, You Just Can't See It.

Wow, 12 posts already, my, I do like to ramble.

And ramble on I will!  There is a reason for this rambling I do, and that is one of soundness.  I am calling Consumer Reports out on their recent report on arsenic they found in samples of rice they tested.  I am making a case that the amount of arsenic they found and printed in red does not warrant the use of the terms "troubling," "worrisome," "cause for concern," or "potentially harmful."

I could just stop at one post and call them a bunch of cotton-headed ninny muggins and be done with it.  And even though I would be right that there is not cause for concern, without supporting my contention, I would be no better then them.

Consumer Reports bases "troubling," "worrisome," "cause for concern," or "potentially harmful," because some rice exceeded a threshold:


For me to say there is no health concern at the maximum concentration of inorganic arsenic found, 9.6 ppb, means I have to show why Consumer Reports concern is not warranted.  The previous 12 posts have focused on what that threshold of 5 micrograms actually means in terms of risk as well as tried to show how exceeding it up to 9.6 ppb does not pose a health concern.  I tried to do this by  by showing how New Jersey came up with the number "5" and how it is dependent on a Slope Factor that most likely does not represent the true risk it theoretically calculates.

If exceeding 5 micrograms per serving is "troubling," "worrisome," "cause for concern," or "potentially harmful," then rice below that amount is not.  And if 5 micrograms is safe, then we assume a certain number of excess bladder and lung cancers is therefor acceptable.  But we can only accept those excess cancers at 5 micrograms if the Slope Factor they used actually reflects the real risk.  And when we look at the actual risk at low levels of arsenic in drinking water, the researchers find:
Since the NRC reports, a number of studies have been published that did not find an increase of internal cancers at low level arsenic exposure. These include Guo (2000), Steinmaus (2003), Lamm (2003, 2004), and Bates (2004), all of which found no evidence of an increase in bladder cancer rate at low-level arsenic exposure levels. Both Guo (2004) and Chen CL (2004) found no increase in lung cancer rate at low-level arsenic exposure levels.
Which means when Dr. Lamm reports:
  • An ecologic analysis of the white male bladder cancer risk in the United States found no increase over an arsenic exposure range of 3–59 μg/L (ppb).
  • Case–control bladder cancer studies found no increased risk in the United States for exposures less than 80 μg/day (ppb).
...and we take those numbers, a maximum of 59 ppb and 80 ppb, finding 9.6 micrograms in one rice serving sample will show no increased risk for bladder or lung cancer.

Dr. Lamm, Dr Honeycutt, and the National Rural Water Association lead me to conclude that the Slope Factor - used by New Jersey and the EPA in the draft IRIS document - from data presented by Morales - is incorrect and does not represent the true risk of lung and bladder cancer seen at low levels.

Not so fast, say the NRC researchers:

NRC 2001 Arsenic in Drinking Water

Which leads them to write this:

NRC 2001 Arsenic in Drinking Water

So you mean to tell me that you can calculate the risk from data collected for "Liver, lung, and bladder cancer mortality data [that was] collected from death certificates of residents in 42 villages during 1973 through 1986"....

....And you can make a Slope Factor based on arsenic concentrations in the drinking water wells "collected from wells in the 42 villages between 1964 and 1966" (1)....

...And then you tell me that you cannot calculate the low level risk from the current data available in the US because of "unknown distribution of other risk factors?"

Really?  Tell them what I think about that Col Potter:


Here is what Dr. Lamm points out:
If an ecological study in the range of interest is desired, then the data are available for analysis from US government sources. These data would obviate the need to make speculative assumptions of differences in body weight, fluid consumption, nutritional status, etc. between the study population and the US population.
And here is what the EPA is concluding should be the Slope Factor and risk for arsenic

EPA IRIS

At that Slope Factor, we would expect to see 7.3 excess cancers in 1000 (7.3E-03).

Dr. Honeycutt with the TCEQ says "horse hockey" as well:
For bladder cancer alone, the incidence risk calculated by USEPA based on final draft values for males/females is 3.1E-04 per μg/L. Therefore, based on 2 μg/L as an average drinking water concentration, the estimated bladder cancer risk for the US population would be 6.2 per 10,000 or 62 per 100,000. However, the actual occurrence of bladder cancer in the US is about 23 cases per 100,000 (males/females combined). It would take 3 times the actual bladder cancer incidence for US males/females combined to even make possible the 62 cases per 100,000 estimated due to arsenic exposure from drinking water alone. Thus, the incidence risk calculated by USEPA final draft values for bladder cancer appears to be inaccurate and overly conservative.
Okay, so I have beat the hell out of this dead horse on Slope Factor.


If I have not supported by argument that the Slope Factor is incorrect, and, therefore the 5 ppb is incorrect, there is not more evidence I can offer.  I can say, based on what I have shown in these previous 13 posts, that rice that may go as high as 9.6 μg per serving is not "troubling," "worrisome," "cause for concern," or "potentially harmful."  It is just rice.

I have also concluded this as well about how a Slope Factor for cancer risk is calculated:
The ability to fit a line through data points does not necessarily mean that the underlying data adequately define the shape of the dose-response curve, including the critical low dose region.
(Honeycutt TCEQ)


Next Post: Arsenic in Rice:  Part 14 - Give me a "P"...Arsenic in the Urine

.

Thursday, October 4, 2012

Arsenic in Rice: Part 12 - Look No Closer Than Your Own Backyard

The real problem with Consumer Reports articles on arsenic in apple juice and rice is that it shows concentrations of arsenic that are not "troubling," "worrisome," "cause for concern," or "potentially harmful."

The rice report, specifically, conveys to the public that there is a risk by showing rice samples with arsenic concentrations printed in red.  This table of inorganic arsenic they found in the rice they samples is explained like this::


What message does Consumer Reports want their readers to leave with?  Should they stop consuming rice? Buy only brands without out the "red" numbers?  Throw out the rice they have in their pantries?  What should be done?

What, other than "troubling," "worrisome," "cause for concern," or "potentially harmful," will the average reader conclude when looking at those results?

This is the problem with a threshold.  Safe on one side, unsafe on the other.  What Consumer Reports and their experts are either woefully ignorant of, or are be purposely misleading, is that the New Jersey threshold of 5 ppb does not in itself mean "safe" nor does exceeding it by twice the amount, in this case 9.6 ppb (the maximum inorganic arsenic Consumer Reports detected) mean "unsafe."

That 5 ppb "limit" is nothing more than a number New Jersey wants based on the Slope Factor that shows a one in one million excess bladder/lung cancer risk of 0.003 ppb.

My point - and maybe i made it long ago - is that 5 ppb is just a number that can be obtained, it is not a number that exceeding it is "troubling," "worrisome," "cause for concern," or "potentially harmful."  It came about from a Slope Factor based on data from an ecological study from a high exposure population in Taiwan.
The Taiwanese dataset [data underlying the study Wu et al. (1989) study and the analyses in Morales et al. (2000)] has been analyzed by the NRC (1999; 2001) and the EPA]. It has served as their analytic database for estimating the risk of internal cancers from the ingestion of water containing inorganic arsenic. NRC considered that the reason for modeling with the SW-Taiwan data was that at that time there was insufficient information to assess the risk from low-level exposure and only the SW-Taiwan study had a sufficient quantity of data over a wide range of arsenic exposures that could be used for risk analysis and extrapolation. (Lamm 2005)
That same dataset is also being used EPA to lower the MCL of arsenic to 3 ppb, and it is based on the Slope Factor derived from that data.  That Slope Factor, the one that leads Consumer Reports to 5 ppb "limit" and is sending the EPA towards a 3 ppb limit, is being questioned as to its validity and the potential damage it will cause if it is adopted if it is indeed incorrect.  As Dr. Honeycutt with the TCEQ tells the EPA:
Proceeding with this SFo will unnecessarily alarm the public by giving a greater perception of harm and risk than is actually taking place.
Dr. Honeycut is not the only one who takes issue with the draft IRIS report and the Slope Factor derived from the Taiwanese dataset.  Here is what the National Rural Water Association wrote about this draft IRIS report:
High quality data from the US and elsewhere indicate much lower risks from iAs ingestion at the levels of exposure relevant for the past and current MCL, yet these studies are not used at all in the Agency’s new quantitative risk assessment because EPA focuses exclusively on the Taiwanese data.  
I know what you may be thinking: Well of course those two are opposed to a lower standard!  It's going to cost them money and effort!  Yeah, that could be the driver, but in the end, is what they are saying, their "point" sound?  Heck, even though I have no dog in this hunt, I have used 12 posts to support my point, and I got a lot more support I am going to throw out there.

Okay, so I'll give you the bias angle, is there anyone else that takes issue with the EPA and the dataset used to determine the Slope Factor?

Well I found something written by this guy named Steven H. Lamm.  He is an MD and an MPH (like me) and bills himself as a "Consultants in Epidemiology & Occupational Health, LLC. with Johns Hopkins University-Bloomberg School of Public Health Georgetown University School of Medicine."

I found a letter from him to the EPA Science Advisory Board (SAB), dated September 5, 2005.  He writes:
There are many questions regarding data quality that are raised by the above analysis. Are the diagnoses correct? Is the case count correct? Is the population ascertainment and subsequent person-year distributions correct? Is the well inventory complete and accurate? Are the arsenic measurements correct? Did the residents only drink from their village wells? Was the arsenic level constant over decades? Were the risks independent of subsequent switch to piped water both quantitatively and temporally?
What becomes troubling about the Slope Factor the EPA wants to use is that they seem to be ignoring this:
As the data to examine these questions is limited or absent, we have to accept various assumptions. We are struck with the observation that in multiple ways when the data is bifurcated, the dose-relationship differs in the two sections. We conclude that there exists within the data some additional unobserved factor(s) that influences the outcome, but has not been adequately identified or characterized. Lamm
And now the plot thickens.  Remember how the Rural Water guys said "High quality data from the US and elsewhere indicate much lower risks from iAs ingestion at the levels of exposure relevant for the past and current MCL?"  Well here is what Lamm reports to the EPA - using the same data used by the EPA:
We noted that the lower level exposure villages showed a negative slope with R2 = 0.25, which appears to be inconsistent with the general expectation of a dose-response model, though p=0.10.
The SW-Taiwan dataset reflects significant inherent geographically-based risk factor(s) which, when disentangled, reveal no significant arsenic-dependent risk for bladder and lung cancers for the low-level exposure villages.
"Disentangled,"  hehe, MPH's use funny words.

Well now...where does all this lead us?  Dr. Honeycutt complains about the noise, Dr. Lamm says the lower dose-level exposed Taiwan villagers reveal "no significant arsenic-dependent risk for bladder and lung cancers," and The National Rural Water folks wonder why the EPA is not looking at "data from the US and elsewhere indicate much lower risks from iAs ingestion at the levels of exposure relevant for the past and current MCL."

That's a good question, that last one.  Why don't we look at US exposure to arsenic and compare bladder & lung cancer incidence based on exposure?  I mean, to me, that would show if these low levels of arsenic actually do present the same degree of risk the EPA's new Slope Factor is predicting.

I mean, wouldn't current data using American's with American habits and American data on cancer make a much better study group?  Has that been looked at?  Why yes, yes it has.  According to Dr. Lamm in Environmental Health Perspectives 2006 July; 114(7): 1077–1082:
  • An ecologic analysis of the white male bladder cancer risk in the United States found no increase over an arsenic exposure range of 3–59 μg/L (Lamm et al. 2004). 
  • Case–control bladder cancer studies found no increased risk in the United States for exposures < 80 μg/day (Steinmaus et al. 2003)
Interesting...

Dr. Lamm finds:
  • A threshold-like model indicating that the bladder cancer mortality risk does not increase with exposure levels < 150 μg/L is consistent with other epidemiologic data.
  •  Cigarette smoking still remains a risk factor for bladder cancer.
So here is my take on this.  We have really, really good data on the arsenic concentration in water that is consumed.  For example:

Evaluation of Arsenic Contamination in Texas
...and we have really, really, good data on cancer

Source

So putting the two together, me thinks we would see elevated incidence of bladder and lung cancer in areas where the arsenic is highest and less in areas where the arsenic is low.  At least that data would be newer and more complete and any confounders present would be relatively the same as in Taiwan.

Makes sense to me to look here as well as there.


Arsenic in Rice: Part 13 - It's There, You Just Can't See It.

.

Wednesday, October 3, 2012

Arsenic in Rice: Part 11 - Dose-response is the cornerstone of toxicology

From 2010 Draft IRIS we learn:
In response to comments from NRC and SAB, a slightly different approach to estimate cancer risks for U.S. populations is being used. In the following analysis, arsenic concentrations corresponding to an additional 1% lifetime cancer incidence (effective dose; ED01 values) above “background” are derived for each endpoint [bladder/lung cancer].

A little primer on EDs...
NRC

 Using the Morales et al. data, the EPA IRIS reports:
Depending on the model used and the comparison population used in the analysis, the effective dose at the 1% level (ED01) estimates ranged from 21 to 633 ppb for male bladder cancer, and from 17 to 365 ppb for female bladder cancer. The lung cancer risk for males was found to be slightly higher than the bladder cancer risk, with ED01 estimates ranging from 10 to 364 ppb.  The risk for female cancer tended to be higher than that of males for each cancer type. For lung cancer, female ED01 estimates ranged from 8 to 396 ppb.
What this means is that the concentration required to obtain an additional 1% cancer incidence for male bladder cancer is either 21 ppb or 633 ppb, depending on what model you use.

Why this is important, this variation of 21 or 633 needed to get the same result - an additional 1% cancer incidence for male bladder cancer, shows up here (draft IRIS):
Also derived are lowest effective dose (LED01) values, which represent the lower confidence limits on the dose corresponding to a one percent lifetime incidence risk in the U.S. population.  [R]isk estimates are derived based on a linear extrapolation from the points of departure (LED01s for lung, bladder, and combined cancers) because the [Mode of Action] MOA for inorganic arsenic is unknown.
What this means, if I am understanding it correctly, is that depending on what model is used, an ED01 is produced.  This ED01 is a statistically derived number and will have a 95% Confidence Interval produced, and the lowest number of that range will produce the LED01.  That number is what is used to produce the Slope Factor which is used to produce the risk of excess cancers which is then used to determine the "safe" dose - the line in the sand - the threshold.

You can see these values, the ED01 and LED01, in Table 5-3:

Draft IRIS Page 131
I can't really do the math here any justice, but what you can see from this table is that the LED01, which is the lower confidence interval, and is used to produce the line (linear extrapolation) from which the Slope Factor is determined, which represents the theoretical potency, which determines the risk (1 in 1,000,000 or 1, 10,000) was based on the lower values spat out by the different models used to calculate the ED01.

...in the house that Jack built!

Confused?  Me too, kind of.  What this shows is that when calculating the Slope Factor the lowest concentrations of arsenic that showed came out of the models were used.  This being the case, with a range of ED01 anywhere from 21 ppb or 633 ppb, for example, means that the risk calculated from these Slope Factors are extremely high.  With that in mind, a serving of rice that has inorganic arsenic 5 ppb over the 5 ppb threshold established by New Jersey is probably no more hazardous for lung/bladder cancer than if it was 5 ppb below that value.

Because the Slope Factor is dependent on a linear extrapolation of the LED01 the numbers used to calculate the ED01 must accurately reflect an additional 1% lifetime cancer incidence above “background.”  

EPA reports in the draft IRIS that these numbers were from 21 ppb or 633 ppb for male bladder cancer depending on what model was chosen.  How far of, then, the Slope Factors are from reality (actual incidence of excess bladder/lung cancer) is anyone's guess.

What there is no guessing about is this.  Eating a serving of rice containing 9.6 μg every day - for 70 years - would not be "troubling," "worrisome," "cause for concern," or "potentially harmful."

But don't take my word for it.  Let's look at what the National Rural Water Association wrote about this draft IRIS report:
The most likely  [Mode of Action] MOA for arsenic correspond to sublinear dose-response models, which when fitted to the available data, suggest much lower cancer risks (by a factor of up to 200) at exposure levels at or below the MCL when contrasted to the EPA’s estimates from the linear model.
..and:
Since the MOA could not be established, the EPA is continuing in its application of the linearized, non-threshold model of dose-response, despite a lack of evidence of increased cancer incidence at typical environmental levels of exposure in the U.S.
...and:
The data of Morales et al. for bladder cancer in a Taiwanese population has been graphed. The arsenic concentration is in μg/L, and the y-axis is lifetime probability of bladder cancer. The solid line is the best-fitting linear model::


Which brings us back to Dr. Honeycutt with the TCEQ:
USEPA used lung and bladder mortality data from Morales et al. (2000) for the dose-response assessment for the final draft SFo.  Morales et al. (2000) uses these mortality data to calculate standardized mortality ratios (SMRs) and notes,
  • “Although the computed SMRs display a large amount of noise, there appear to be higher SMRs at high exposure levels compared to exposures in the lower range, especially for bladder and lung cancer.”
Dr. Honeycutt responds:
To say that there is “noise” in the SMRs over the eight exposure categories is an understatement. 
Dose-response is the cornerstone of toxicology, but the lung and bladder mortality data (SMRs) from Morales et al. provide a poor basis for dose-response assessment as a dose-response is not apparent and not monotonic. 
Breaking the data down into the form of age-specific person-years at risk and cancer deaths does not improve the basis for dose-response assessment; it only obscures the lack of a good dose-response which is readily apparent from examination of the SMRs.

I have whipped this dead horse on the Slope Factor as much as I can.  Let's look at it another way.  Do we see the number of bladder cancers estimated by the Slope Factor derived from the Morales et al. data?

I addressed this once before in a previous post.  I'll do it again with a bit of a different spin.


Next Post: Arsenic in Rice: Part 12 - Look No Closer Than Your Own Backyard

Tuesday, October 2, 2012

Arsenic in Rice: Part 10 - Everyone loves Morales et al.

In my last post, I wrote that eating one serving of rice containing 9.6 μg of inorganic arsenic - every day - for 70 years - would present a risk of 7 in 1,000 excess bladder/lung deaths for females.  This, I wrote,  was 3 excess bladder/lung cancers more than what the "most protective level" of 5 μg/L would theoretically produce.

I want to be clear here and make sure that my point is not being misconstrued.  I am not making the point that 5 μg is not the "most protective level" and that it should be lower, say 0.003 μg/L.  On the contrary, what I am trying to get across is that 5 μg/L is not an appropriate number to establish a threshold.  Not because it is too high, but because it does not imply "safe" and "unsafe" like Consumer Reports and their experts are wanting us to conclude.

That number -  5 μg/L - is just a number to support getting the arsenic concentration down as low as we can to the stated goal of "zero."  If we understand environmental causes of cancer correctly, then anything above zero is a risk.  This does not have to paint us into a corner, but it does.

Why?  Because Consumer Reports implies that a serving of rice exceeding 5 μg/L is "troubling," "worrisome," "cause for concern," or "potentially harmful."  They assume that 5 ppb is "safe" and that above that is "unsafe."

"Troubling," "worrisome," "cause for concern," or "potentially harmful," was used by Consumer Reports to convey "unsafe" for two reasons in my opinion:
  1. They do not understand what New Jersey's 5 μg/L arsenic in drinking water represents, and;
  2. They are pushing a zero threshold agenda
Again, so that my message is not misconstrued:
If Consumer Reports considers New Jersey's arsenic standard of 5 μg/L the "safe" threshold for rice....and;
Rice that has up to 5 μg/L of inorganic arsenic per serving would not make it "troubling," "worrisome," "cause for concern," or "potentially harmful."....and;
New Jersey considers 5 μg/L to be the "most protective level"...and;
Based on the EPA Oral Slope Factor derived from data produced by Morales et al,  5 μg/L would result in a risk of 3.6 excess bladder/lung cancers in 1,000....
Then Consumer Reports agrees that a risk of 3.6 out of 1,000 excess bladder/lung cancers is most protective of the population that consumes one serving of rice per day for 70 year.
You can see why I take issue with the conclusions presented by Consumer Reports and the experts.  They imply that on this side it is "safe" and on that side it is "unsafe."  It is neither.  Which is why using an MCL should never be used to present to the public a comparison of the ranges where the MCL is exceeded.

Consumer Reports is wrong, wrong, wrong, on this.  It does not provide a "yardstick" - it provides the public nothing but confusion and concern.  Which is exactly the point Dr. Honeycutt with the TCEQ was driving at:
Proceeding with this SFo [Oral Cancer Slope Factor from Morales et al.] will unnecessarily alarm the public by giving a greater perception of harm and risk than is actually taking place.
By using red ink in their tables, as well as using the terms "troubling," "worrisome," "cause for concern," or "potentially harmful," Consumer Reports has alarmed the public by supporting a greater perception of harm and risk than is actually taking place.  This is inexcusable for a magazine of this caliber and extremely unsettling that their toxicological experts were not knowledgeable of this fact.

So let's get back to it shall we.  Is inorganic arsenic in a serving of rice that is greater than 5-ppb but less than 10 ppb "troubling," "worrisome," "cause for concern," or "potentially harmful?"

Only is you think an increase of risk from 3.6 in 1,000 to 7 in 1,000 is substantial enough.  And that increase is also dependent on consuming a serving of rice each day for 70 years with 9.6-ppb inorganic arsenic (we will ignore for now the fact that the average concentration of arsenic found in all the samples was below 5 ppb and assume that each day the rice contains the maximum level found - 9.6 ppb).  Oh, and another thing we need to consider is that the risk, from 3.6 to 7, is dependent on the Oral Slope Factor that was developed using data from Morales et al. (2000).

Let's look at that Morales et al. data, shall we?  First off, I am not trying to make a case that the data is - or is not - valid.  I will assume it is.  What I want to show is how much uncertainty there is in the final Oral Slope Factor that was calculated.  This uncertainty makes the increase in risk from 5-ppb to 10-ppb impossible to calculate with any degree of accuracy.  Yet, there it is, used by Consumer Reports to draw a line in the sand, a threshold held up as sacrosanct.

Here is what the EPA has to say about the data they used from Morales et al.:
The calculation of cancer risks from the Taiwanese epidemiological data was performed using Excel workbook files. The files contained the input data for the dose-response models and spreadsheets to accept user-specified inputs, perform calculations, and summarize outputs from the assessment. Input data included male and female lung and bladder cancer mortality and person-years at risk (PYR) data for arsenic-exposed populations from 42 villages obtained from Morales et al. (2000), village water arsenic concentrations (minimum, median, and maximum data sets), and southwest Taiwan and all Taiwan reference population mortality and PYR data.
You can download those Excel files here.  Digging a bit deeper, we get this from the EPA in the IRIS draft report:
The Morales et al. (2000) ecological investigation re-analyzed data originally reported by Chen et al. (1988a, 1992) and Wu et al. (1989) from 42 villages in the arseniasis-endemic region of southwestern Taiwan by considering the number of liver, lung, and bladder cancer deaths.  Morales et al. (2000) used a generalized linear model (i.e., Poisson distribution) and the multistage-Weibull models to determine lifetime cancer risk estimates. Liver, lung, and bladder cancer mortality data were collected from death certificates of residents in 42 villages during 1973 through 1986.
Okay, they collected data from death certificates...
Drinking water samples had been collected from wells in the 42 villages between 1964 and 1966.
...and Morales et al. used sample data from 1964 through 1965.  Well...okay...
SMRs [standard mortality ratio] were used to summarize the observed patterns of mortality in the collected data. Morales et al. (2000) selected two comparison populations (the Taiwanese population as a whole and a population from a southwestern region of Taiwan) to account for urban versus non-urban populations differences.
...okay...standard toxicological stuff...
Although a non-significant trend was observed in the combined cancer analyses with respect to age, there was no observed tendency in liver, lung, or bladder SMRs with respect to age. This suggests that there is no age dependency on the risk ratio.
...okay, that takes out one confounding issue...
The Morales et al. (2000) investigation results showed that exposure-response assessments were highly dependent on the choice of the analysis model and whether or not a comparison population is used in the analysis.
And the reason?....
One possible explanation for this observation is the inherent uncertainty associated with the limitations of an ecological study design. Depending on the model used and the comparison population used in the analysis, the effective dose at the 1% level (ED01) estimates ranged from 21 to 633 ppb for male bladder cancer, and from 17 to 365 ppb for female bladder cancer. The lung cancer risk for males was found to be slightly higher than the bladder cancer risk, with ED01 estimates ranging from 10 to 364 ppb. The risk for female cancer tended to be higher than that of males for each cancer type. For lung cancer, female ED01 estimates ranged from 8 to 396 ppb.
Wait...the number used to calculate the Slope Factor is based on the 1% effective dose (ED)...and that number ranges from 21 to 633 ppb, 17 to 365 ppb, 10 to 364 ppb, and 8 to 396 ppb for the two cancers in men and woman?

And they calculated a Slope Factor that was used to support a standard of 5 ppb for arsenic in drinking water.  And Consumer Reports wants me to believe that exceeding 5 ppb up to a maximum of 10 ppb in a serving of rice is "troubling," "worrisome," "cause for concern," or "potentially harmful?"

Really...are you serious Consumer Reports?  You are basing it on a threshold for arsenic in drinking water that uses data with this in play:
Weaknesses include the ecological study design (i.e., there were no individual monitoring data and individual exposures were not available) and the fact that potential confounders such as smoking, dietary arsenic, and the use of bottled water (U.S. population) were not controlled for in the analysis.
And in spite of these weaknesses, the EPA and New Jersey, and the NRC marched forward with a Slope Factor.  Which is exactly why Dr. Honeycutt with the TCEQ made this statement:
Proceeding with this SFo will unnecessarily alarm the public by giving a greater perception of harm and risk than is actually taking place.
So how "off" can this excess cancer risk be?  Glad you asked that, now I can move on to the 11th post.


Next post:  Arsenic in Rice: Part 11 - Dose-response is the cornerstone of toxicology

Monday, October 1, 2012

Arsenic in Rice: Part 9 - The Broad Shoulders of Morales et al.

Consumer Reports has drawn a line in the sand regarding the amount of inorganic arsenic they found in a bunch of different rice samples they collected and analysed.


Consumer Reports uses the New Jersey threshold - MCL - for water, 5 μg/L.  That threshold was based on analysis by the NRC on data proved by Morales et al.
Morales, KH; Ryan, L; Kuo, T-L; et al. (2000) Risk of internal cancers from arsenic in drinking water. Environ Health Perspect 108:655–661.
5 μg/l was what the EPA originally proposed an arsenic standard but in January 2001, it was changed to 10 μg/l.  The consensus of EPA, was to get the MCL down to 5 μg/L.  Enter a new President and a new director of the EPA, and in 2010,  IRIS issues an "External Review Draft" called the "Toxicological Review of Inorganic Arsenic (Cancer).  It is important to not here, that this draft has been in the making since 1999.  A different administration views the risk differently.  Which is one of my points.  How should we quantify risk for water and rice that is reasonable, prudent, and...well...reflects reality.

These cancer risks are based on a Slope Factor, which is "the theoretical cancer potency estimate for humans." (CalEPA)

I'm going to argue that this "theoretical cancer potency estimate" paints us into a corner when attempting to communicate the risk of exposure, especially the risk to a chemical suspected of causing cancer in humans.

It is not that it is "theoretical" that I take issue with, it is that the number it derives - the excess cancer risk - is not a threshold whereby exceeding it by 1, 5, or 10 ppb becomes "troubling," "worrisome," "cause for concern," or "potentially harmful" as Consumer Reports points out that it does.

If I am going to support my conclusion that the rice is "safe," I am going to have to show why exceeding the 5 ppb threshold is not harmful.  The thing is, I can't do that.  I have been painted into a corner that says there is no safe exposure to a carcinogen.  This corner is also where New Jersey finds itself when it says the drinking water concentration that results in a one-in-one-million excess lifetime risk meets their law as an acceptable risk.

This corner gives us no where to go based on this thinking.  This is why Dr. Honnycutt with the Texas Commission on Environmental Quality made this statement to the EPA about their 2010 External Review Draft on the  "Toxicological Review of Inorganic Arsenic (Cancer)."


Like I said previously in my past posts, exceeding 0.003 μg/L increases the risk.  Accepting the threshold of 5 μg/L as the "most protective level" assumes that one then accepts a new risk threshold of 2 excess cancers per 1,000 (2E-03) based on consuming two (2) liters of water at 5 μg/L.  This is based on a Slope Factor that I calculated based on a 1 in 1,000,000 risk at 0,003 μg/L (I assumed 2 liter/day).

Let's instead look at the risk using the new and improved draft IRIS values, which are based on an Oral Cancer Slope Factor for women:

2010 Draft IRIS Page 150-151

Based on the IRIS data, which is based on data from Morales et al. (2000), drinking on liter of water, or consuming one serving of rice (Consumer Reports) with 0.14 μg/L (ppb)  would present an excess cancer risk for lung and bladder in women of 1 in 10,000 (10-4, the acceptable risk for carcinogens in water.)

Using that same data, consuming one serving of rice that had the highest concentration of inorganic arsenic (9.6 μg)  for a lifetime - 70 years- would see an excess cancer risk of  7.3 in 1,000 in women.

Looking at it another way, if the "unit risk" for arsenic is 7.3 in 10,000 for one μg of arsenic in water, 10 μg would increase that risk 10-fold - 73 in 10,000 or 7.3 in 1,000.

If we can accept that unit risk, which was derived from data provided by Morales et al. (2000), then we can figure out what the excess cancer risk is at New Jersey's "most protective level" of 5 μg/L:
5 μg/L x 7.3E-04 = 36.5E-04 or 3.6 in 1,000.

Now we can have some fun....

According to Consumer Reports:
Using the 5-ppb standard in our study, we found that a single serving of some rices could give an average adult almost one and a half times the inorganic arsenic he or she would get from a whole day’s consumption of water, about 1 liter.
Therefore, one serving of rice that contained the maximum concentration of inorganic arsenic detected, 9.6 μg:


...would present a risk of 7 in 1,000 excess bladder/lung deaths for females - which is 3 excess bladder/lung cancers than what the "most protective level" of 5 μg would theoretically produce.  This is all based on the following assumptions:
  • The female weighs 70 kg.
  • The female eats one serving of rice containing 9.6 μg inorganic arsenic - every day - for 70 years.
  • The female gets bladder or lung cancer.
  • The female dies from bladder or lung cancer.
All of those assumptions must be met to get an excess cancer risk of 7 in 1,000.  If she was to consume one serving of rice were with 5 μg of inorganic arsenic - every day - for 70 years, we would see an excess cancer risk of 3.6 in 1,000 which Consumer Reports tells us is at the "most protective level."

And, even if all of those assumptions play out, that excess cancer risk is dependent on a Slope Factor that was developed from data produced by Morales et al.


Next post: Arsenic in Rice: Part 10 - Everyone loves Morales et al.


.

Sunday, September 30, 2012

Arsenic in Rice: Part 8 - How Low Can You Go?

Consumer Reports implies that rice above a 5 ppb standard poses a "troubling," "worrisome," "cause for concern," or "potentially harmful"situation for those who eat it.
Using the 5-ppb standard in our study, we found that a single serving of some rices could give an average adult almost one and a half times the inorganic arsenic he or she would get from a whole day’s consumption of water, about 1 liter.
That threshold of "5-ppb" came from New Jersey:
[t]he 5 μg/l arsenic MCL [was selected] after consideration of the findings and recommendation of the New Jersey Drinking Water Quality Institute (Institute). The Institute reviewed the reports issued by the National Academy of Sciences (NAS) on the health effects of arsenic in drinking water in 1999, as well as an update of this report released in 2001 (Arsenic in Drinking Water: 2001 Update, NAS Press, 2001).  Based on the current NAS analysis, the Institute determined that the drinking water concentration that results in a one-in-one-million excess lifetime risk of lung and bladder cancer for United States populations was an estimated 0.003 μg/l (or three nanograms per liter or three parts per trillion).
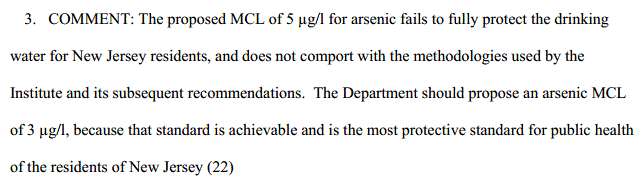
Therefore, in view of its concerns regarding reliable removal technology, the [New Jersey Department of Environmental Protection] determined to promulgate the arsenic MCL at 5 μg/l. This determination comports with the NJSDWA mandate to establish the MCL at the most protective level within the constraints of medical, scientific and technological feasibility.
Even at that, some folks, like Jeffrey H. Tittle with the Sierra Club were not happy:

Source
How New Jersey got to "5-ppb" is important because it is what Consumer Reports uses to inform their readers that rice samples found with inorganic arsenic over that threshold of "5-ppb" is "troubling," "worrisome," "cause for concern," or "potentially harmful."  If 5-ppb is okay for Consumer Reports and is implied to be "safe," they are telling the Sierra Club that 3-ppb is too low.  But I digress....

5-ppb, which is 5 μg/l, was the amount settled on because a water system cannot effectively treat water to get the arsenic down below 5 ppb.  If you cannot treat it to less than 5 ppb, then all water systems with arsenic above 3 ppb would be in violation.  Even though the Sierra Club and the NJ Institute believe 3 ppb should be the standard, that unfortunate little devil called "reality" steps in and tells them that you can't always get what you want.

The point here is this:  5 ppb or 3 ppb is not the number that will get you to what New Jersey's law wants - which is an excess cancer risk of one in one million.  To get to that risk level, 1 in 1,000,000 the water must have an inorganic arsenic concentration of  "0.003 μg/l (or three nanograms per liter or three parts per trillion)."

My point is that none of these numbers, 5 μg/l, 3 μg/l, or 0.003 μg/l, are thresholds to which exceeding them by up to 5 ppb would be "troubling," "worrisome," "cause for concern," or "potentially harmful," as Consumer Reports tells its readers.

So lets look at just how conclusive that number of 0.003 μg/l (or three nanograms per liter or three parts per trillion) is.  That number presents an acceptable risk on one excess bladder/lung cancer per 1,000,000.  Basically anything above 0.003 μg/l increases the risk.  When, I will ask, does that increase start to meet the Consumer Reports designation of "troubling," "worrisome," "cause for concern," or "potentially harmful?"

New Jersey came up with the Slope Factor that produced 0.003 μg/l,using the research performed by the National Academy of Sciences (NAS) who put forth the NRC report,  In the NRC report we learn:
Because the EPA did not present theoretical lifetime excess bladder and lung cancer risk estimates [in 2000], the [NAS] used linear extrapolation from the EDs [1% Effective Dose's] presented in Morales et al. (2000) to estimate these risks at 3, 5, 10. and 20 μg/l .
So here we are in 2012.  New Jersey settled on 5 μg/l, they proposed 3 μg/l which would have made the Sierra Club happy, but REALLY wanted 0.003 μg/l.  The EPA, on the other hand, came up with an MCL of 10 μg/l and an MCLG of zero.

So many numbers, so many choices of "safe."

And when you look at how those numbers were derived, one thing starts to pop out at you (well at me anyway).  That is, there is a connection that binds them all:
After the publication of the proposed rule, Morales et al. (2000) published a study in which a risk assessment for mortality from several internal cancers was presented.  The risk assessment was based on reanalyses of the data from southwestern Taiwan.  Risk estimates were calculated for mortality from lung, bladder, and liver cancers, as well as combined cancer deaths, using 10 different statistical models, calculated with and without a Taiwanese comparison population.  [NRC]
Which then tells us this:
EPA was considering those analysis in the final rule making [that established the current 10] and, therefore, published a Notice of Data Availability in the Federal Register summarizing and further analyzing the information from Morales et al. [NRC]
Which leads to the EPA producing a draft document in 2010 called the "IRIS Toxicological Review of Inorganic Arsenic (Cancer)" where we learn this:
In the course of this analysis, EPA has investigated the impact of alternative model forms on the cancer risks estimated for the Taiwanese and U.S. populations for individual endpoints (lung and bladder cancer). Based on the past experience of Morales et al. (2000) and modeling results presented by NRC (2001), this effort was limited to exploring alternative forms for the dose dependence of risks.
These MCLs, these thresholds for what is "safe," are the result of a Slope Factor that is used to estimate excess cancer risk from inorganic arsenic that was derived this way:
EPA investigated a range of model forms for use in the risk assessment, building on previous efforts, including U.S. EPA (2001) and Morales et al. (2000).  The model used in the derivation of the preferred risk assessments employs:
    • Poisson regression (of cancer mortality against age and dose) fit by maximum likelihood estimation (MLE).
    • A quadratic age model.
    • A linear multiplicative dose term.
    • Confidence limits on the dose term estimated by profile likelihood.
    • Estimates derived for the data set that includes the southwest Taiwan reference population.
That's complicated toxicologist talk.  What I want to focus on is that all of these numbers are based on a Slope Factor that comes from data provided by some guy named "Morales" and his friends "et al."

Morales...Morales...Morales...


Next Post: Arsenic in Rice:  Part 9 - The Broad Shoulders of Morales et al.

.

Saturday, February 25, 2012

Apples, Arsenic, and Risk - Part 20: It is - and always will be - about the dose.


"All substances are poisons; there is none which is not a poison. The right dose differentiates a poison…." Paracelsus (1493-1541).

I hate to keep whipp'n that dead horse, but that's what is missing in these discussions on the arsenic that has been found in apple juice.  Let's look at what Russell H. Greenfield, MD says on the Dr. Oz website regarding arsenic in apple juice:
The 10 ppb level [arsenic MCL for drinking water] is simply as close as we can reasonably get considering our natural exposure to arsenic in the environment and other limitations. At that level, almost all experts agree our drinking water is quite safe.
Shouldn't the same goal or, at the very least, similar science-based exposure guidelines, be in place for the juices we commonly give to our children?
What goal would Dr. Greenfield want to see?  Consumer Reports thinks "the standard should be 3 ppb" and the FDA, on December 15, 2008, issued a memo on research they had done regarding arsenic in the juice:
In conclusion, the chronic consumption of apple juice products containing over 23 µg/L (ppb) inorganic arsenic would represent a potential health risk.
The FDA in 2008 says 23 ug/L is the maximum total arsenic in apple juice that would not pose a potential health risk.  That 23 ug/L is based on the actual dose a child would take in (uptake) based on how much apple juice is normally consumed.  That's the way it is supposed to be done, that's the way the FDA did it in 2008, so why does Consumer Reports, Dr. Oz, Dr. Greenfeild, and good ol' Chuck Norris think the FDA has dropped the ball on this?

Let's look at how the FDA came up with that:
Consumption estimates were based on average consumption over two days for individuals who consumed apple juice (eaters only) and were calculated for two population groups: Males and females (MF) from birth to 2 years of age and MF 2 years of age and older.  
The estimates included foods codes for products that were 100% apple juice, including infant apple juice; juice blends that included apple juice as an ingredient were not included.
Relying on results of the more recent 2003-04 NHANES, consumption of apple juice by MF birth to 2 years was estimated to be 16.7 and 36.2 g/kg body weight/day at the mean and 90th percentile, respectively, compared with previous estimates of consumption for all juices of 19.1 and 43.4 g/kg body weight/day.  
For MF 2+ years, consumption of apple juice was 6.0 and 12.9 g/kg body weight/day at the mean and 90th percentile, respectively, compared with the previous estimates for all juices of 6.0 and 13.0 g/kg body weight/day. 
Since consumption estimates from both surveys are similar, the level of concern (LOC) that was calculated for the previous assessment (23 ug/L, or ppb) can be applied in the case of apple juice. 
The 23 ug/L is for inorganic arsenic and is based on the dose a child would take in drinking apple juice.  The reason that number is higher than the 10 ug/L for arsenic in drinking water is that the dose from drinking water is estimated to be 20 ug at the 10 ug/L MCL.  This is because the MCL is based on drinking 2 liters of water per day.

What that means is this:
A 30 kg child (66 pounds) drinking 36.2 grams of apple juice per kilogram of body weight consumes 1086 grams of apple juice which is 1.1 liter.  That's the amount that will deliver the dose of arsenic.  That quantity of apple juice is the 90th percentile highest amount of apple juice estimated to be consumed.  A child drinking that much apple juice would receive 25.3 ug of total arsenic at a maximum FDA acceptable concentration of 23 ug/L.  The highest anticipated "daily dose" for this 30 kg child is 25.3 total arsenic from drinking apple juice.
For drinking water, that same child would consume 2 liters of water at the MCL of 10ug/L for a total daily dose of 20 ug.  That's what the EPA considers a safe dose.
So normal apple juice consumption will see less than 25.3 which is equivalent to what would be consumed if drinking two liters of water at the MCL for arsenic of 10 ug/L.

Drinking apple juice at a total arsenic concentration of less than 23 ug/L is the same as drinking water at the MCL 10 ug/L for arsenic.  The dose is based on the amount consumed per unit of fluid.  You drink less apple juice per day then water so apple juice can contain more ug/L of arsenic and still be considered safe.

Sounds counter intuitive, especially when you are talking about toxicity. We are concerned with the amount of the toxin - dose - received not the amount of the toxin found.  This is why you cannot compare the MCL for drinking water to the concentration of arsenic found in apple juice.  The MCL has been established for a dose based on consuming 2 liters per day.  You therefore need to compare the dose the receptor is anticipated to receive with the maximum dose - mg/kg body weight - established as "safe."

This is how it works.   It is - and always will be - about the dose when describing toxicity.

23 ug/L of total arsenic presents less dose than a drinking water MCL of 10 ug/L and is based on the assumptions of how much of each is consumed.  As long as the daily dose does not exceed 20 ug for a 70 kg person - or - 0.28 ug arsenic/kg body weight - we will not expect to see any short term or long term potential health risks over a 70 year lifetime!

That's why Dr. Greenfield states on the Dr. Oz website:
At that level [10 ug/L], almost all experts agree our drinking water is quite safe.
Even ol' Chuck Norris agrees with that, although I am pretty sure he has no idea that he does:
At the very least, the FDA should not allow more arsenic in apple juice than it allows in Americans' drinking water.
"Not so fast!" Yells our hero Chuck Norris, "tell them about the cover-up!"  No, Chuck, you tell them:
Tragically teetering on a huge U.S. health cover-up, the FDA posted eight "previously undisclosed test results" for apple juice samples from across the country that had arsenic levels that superseded even its own "level of concern" for inorganic arsenic. Two of those eight samples had an arsenic level of 27 ppb. One had a level of 42 ppb, and two others were at 45 ppb.
Tragically teetering?  Oh chuck, you are such the drama queen!  Here is what the FDA discloses in another memo dated November 21, 2011:
In July 2011, we issued an Import Bulletin to significantly increase the number of juice products sampled and analyzed for arsenic under the Toxic Elements program. Importantly, of the 74 samples collected as a result of this import bulletin, all were from China. Of these:
  • 1 sample was above 23 ug/L total arsenic
  • 1 sample was 10 ug/L total arsenic
  • 2 samples were 11 ug/L total arsenic
  • The remainder, (almost 95 percent), were below 10 ug/L total arsenic.
 Compare that to the arsenic levels reported by Consumer Reports.  But wait, there is more:
[we] now have a total of 160 apple juice samples collected from 2005 to 2011. These include 70 samples posted by FDA on September 27, 2011 and an additional eight samples that were part of this data set. These eight samples, which had not been previously posted, all have total arsenic levels greater than 23 ppb and were in the process of being further verified.
The data set also includes 82 new samples collected in the latter part of 2011 for which the data have just now become available. Of these 160 apple juice samples:
  • Almost 88 percent had fewer than 10 ppb total arsenic
  • 95 percent had total arsenic levels below 23 ppb total arsenic.
Okay...anything else from the lyin' stinkin' covern' up FDA?
Similarly, from the Total Diet Study program:
  • Nearly 77 percent of the 134 composite apple juice samples tested from 1991 to 2009 (including baby food and general consumption samples) had total arsenic levels below 10 ppb.
  • 95 percent had total arsenic levels below 23 ppb.
Cover-up?  C'mon Chuck, this ain't nothin' different than what Consumer Reports found.  How many samples do you need to have analyzed to get you to understand that we're not in any danger.  I mean, really Chuck?
Until then, tides of arsenic will continue to flow from foreign produce fields into American bloodstreams.
Tides of arsenic?  Chuck, Chuck, Chuck...

I have written 20 posts on this topic.  I have tried to show how many of these statements from Consumer Reports, Dr. Oz, and Chuck Norris are not substantiated.

As much as I believe we should consume food that is grown locally and with little to no pesticides, I cannot say that the reason for doing so is because foreign grown apple juice contains more arsenic than American. The Consumer Reports data shows that it does not.

I cannot support lowering the inorganic arsenic level to 3 ug/L.  There is no evidence to support that.  None.  Period.  The FDA's level of concern of 23 ug/L appears to be prudent, justified, and can be supported by the same data used to produce the drinking water MCL for arsenic at 10 ug/L.  And at that level, one more time courtesy of Dr. Greenfield:
"almost all experts agree our drinking water is quite safe."
It is - and always will be - about the dose received and not the amount detected.  You cannot compare the ug/L established for water with the ug/L found in apple juice.  This is no different than comparing a one pound ingot of lead with a one pound feather pillow.  They both weigh the same but one of them you would not want dropped on your head.

Let me sum it all up.  Here is how it works, it only works this way.

If little 2 year old Johnny weighs 66 pounds (30 kg) and he drinks the upper most amount of apple juice the FDA research found, 1.1 liters (36.2 g/kg body weight/day), and that apple juice contains the highest amount of total arsenic the FDA says is safe - 23 ug/L - he would consume 25.3 ug of total arsenic each day he drank 1.1 liters of apple juice.

That's a pretty big two year old and that's a lot of apple juice to drink, but that's a potential and I'm trying to force a "worst-case" scenario to illustrate my point.

25.3 ug for a 30 kg child comes out to 0.84 ug arsenic/kg body weight.  0.84 ug is 8.4E-4 mg/kg.

The IRIS reference dose (RfD) for inorganic arsenic is 3.0E-4 mg/kg-day.  Now before you say "whoa! That's more than double" remember this:
In general, the RfD is an estimate (with uncertainty spanning perhaps an order of magnitude) of a daily exposure to the human population (including sensitive subgroups) that is likely to be without an appreciable risk of deleterious effects during a lifetime.
Little Johnny will not drink more apple juice per body weight when he gets older, in fact, the FDA reports that after two years of age, a child drinks about half of that amount per body weight.  And as their body weight increase towards 70 kg, the dose of arsenic received per body weight gets less and less each day they consume apple juice.  So that at the end of 70 years, the dose of arsenic is around 3.0E-4 mg/kg-day based on a max of 23 ug/L.

Oh, and that worst-case amount of arsenic, 8.4E-4 mg/kg-day, is for total arsenic.  Looking at the Consumer Reports data, inorganic arsenic is about 30% less than that.

Nevertheless you may say, this worst case mega-heavy-baby little Johnny is consuming more than the IRIS RfD of 3.0E-4 mg/kg-day of inorganic arsenic based on these FDA estimates and calculations.

True that, but I have another little bit of information that will let me know everything will come out OK.  Even if little Johnny were to drink 1.1 liters of apple juice with 23 ug arsenic every day and never weigh more than 30 kg, the estimated dose of total arsenic - 8.4 mg/kg-day - is just barely above the NOAEL (No Observable Adverse Effect Level) of 8.0E-4 mg/kg-day listed by IRIS for inorganic arsenic and well below the LOAEL (Lowest Observable Adverse Effect Level) of 1.4E-2!

So is the FDA correct in identifying 23 ug/L arsenic in apple juice as a level of concern?  Yes.

Can the FDA substantiate their claim that:
...the chronic consumption of apple juice products containing over 23 µg/L (ppb) inorganic arsenic would represent a potential health risk.
Yes.

Is Dr. Russell H. Greenfield, MD correct when he says:
It remains very unlikely that you have done any harm to yourself or to your children through the drinking of apple juice. 
Yes.

Can you and your kids drink apple juice despite all of the misinformation and assumptions made by Consumer Reports, Dr. Oz, and Chuck Norris?

Yes.

Everything in moderation.

Now, how do you like them apples!


.