Showing posts with label cancer slope. Show all posts

Friday, May 25, 2018

Coffee, Acrylamide, and Proposition 65 - Part 8

Here is something interesting that California states when discussing their current list of NSRLs for chemicals "known to the state to cause cancer:"
These safe harbor levels do not preclude the use of alternative levels that can be demonstrated by their users as being scientifically valid. A hyperlink is provided for those NSRLs or MADLs for which the documentation of their derivation is electronically available. (source)
That hyperlink acknowledges that there is information regarding a "derivation" from the established values written into law.

You will notice that there is no hyperlink for acrylamide and cancer. There is a document - the one I have been using - but California doe not link it. That document states this:

If you are good at the maths. you may know this already, but the larger the Cancer Slope Factor (aka Cancer Potency) the lower the NSRL value.

If it were me advising Starbucks et. al. I would have told them to do the following.
  1. Find out the actual (statistically valid) concentration of acrylamide in YOUR coffee.
  2. Find an adequately researched and recognized institution that claims a lower Cancer Slope Factor for acrylamide
  3. Calculate the highest amount of acrylamide seen in the largest dose (cup) of coffee a customer can order.
If that "actual" concentration of acrylamide is less than the new calculated NSRL, plead your case based on California's own words:
These safe harbor levels do not preclude the use of alternative levels that can be demonstrated by their users as being scientifically valid.
Here's how I would do it using new data that I consider valid and demonstrated.

Based on what we know about the average amount of acrylamide in all coffees, we can assume the following for Starbucks:


Using the NSRL established in the March 2005 document, only the Venti would exceed the NSRL. And if "1" is a cancer risk of one in 100,000 and therfore, according to California, a "No Significan Risk Level, what happens when the amount of acrylamide in a Venti is 1.6 micrograms?

Let's go back to my Excel sheet and see if we can calculate the risk when we know the concentration of acrylamide in a Venti cup of coffee:

Okay, so using the Cancer Potency and the NSRL established in the March 2005 document, the added risk of cancer would be and additional 1.3 per 100,000. Since a one in 100,000 is considered a No Significant Risk Level, then are concern is for cancers over the one in 100,000, in this case we would say that we have a risk to consider of 1.3 additional cancers in a population of 100,000.

Remember, as California tells us...:
Cancer now occurs in nearly one out of every four individuals.
So by drinking a Venti each day for 70 years you jump from 25% to 26.3 percent.

But all of that assumes that the Cancer Potency California came up with is accurate. That is, is 0.7 a valid number and better than any other numbers that could be generated?

Let's take a look, shall we?


Source
What this bell curve shows is a bunch of computer simulations, 100,000 trials based on this:
Since acrylamide induced tumors at multiple sites in male and female rats, combined potency estimates were derived for each experiment using Monte Carlo analysis for those tumor sites judged to be associated with exposure to acrylamide. For each tumor site, a distribution of estimates corresponding to the 0.1 through 99.9 percentiles of the linear term (q1) of the multistage model was generated...
If - IF - those rat studies are valid, then the actual number is somewhere in that bell curve. Again, since they force the line linear with 0 as the risk and concentration, the Cancer Slope Factor is questionable. But since its all we got, let's roll with it.

Now if you are not familiar with statistics and bell curves, you need to know this. Between two standard deviations from the mean value (the highest peak in the bell curve) lies 95% of all the numbers it could be. COULD be.

California - to be safe - uses the upper 95% value which is two standard deviations to the right of the mean. That number is 0.70. Where have I seen that number before?


If I were advising Starbucks et. al. I would now get fired because everyone listening to me is bored and falling asleep. Still, I soldier on! I yell:
"If 0.70 is valid, well so is 0.20 because (pant! pant!) both of those number have an equal chance of being the real number with a 95% confidence. I mean...if you are going to say 0.70 is the number you can also say 0.20 is the number. Why do you get to pick the upper when the lower is just as valid?"
Now if the judge could channel King Solomon, he might say "Enough you two! Let's cut that baby in half - 0.50 looks pretty close to the peak - 50% for you and 50% for the state."

Aha! the judge fell right into my trap! I can support that number of 0.50. And if I can support it because California does not...
...preclude the use of alternative levels that can be demonstrated by their users as being scientifically valid.
,,,Then I win for Starbucks et. al. provided the judge agrees with my work.

So the question is, what makes 0.50 a number that you were hoping for Bowman? Well, let me show you...

EPA IRIS Acrylamide 

I think I could make a persuasive argument that the EPA IRIS presents "levels that can be demonstrated by their users as being scientifically valid."

So if I were to present 0.50 as the Cancer Potency (aka Slope), the my NSRL becomes...
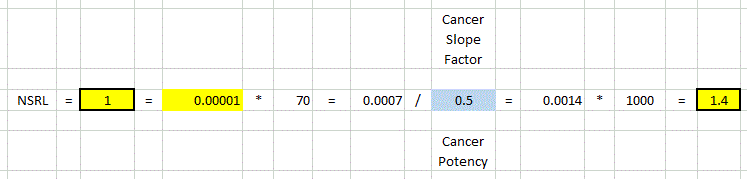

And when we look at the estimated amount of acrylamide in a Starbucks coffee:


Close...but not out of the woods yet. This is why you need to know how much acrylamide is in a Venti. Why they did not go through this is beyond me. Had the amount of acrylamide been similar, they could have fallen back on their original defense. Had it been lower, they could have said "our coffee presents a NSRL for acrylamide."

Now, if I could get the judge to accept 0.50 as the Cancer Slope, the amount of acrylamide is above the NSRL of 1.4 micrograms per day by only 0.20 micrograms, which presents an additional risk above one in 100,00 as follows:


An additional 0.14 per 100,000 cancer risk for drinking a Venti every day for 70 years. I think I may have had a shot at this if I did not bore them to death.


Next Post: Coffee, Acrylamide, and Proposition 65 - Part 9 - The End!

Thursday, May 24, 2018

Coffee, Acrylamide, and Proposition 65 - Part 7


Eight posts on this. Well if you are still reading we are getting close to the end.

Let's go back to this graphic:


If you will recall, I told y'all to pay attention to the writing in blue. The forcing of the line to have zero dose = zero risk is what sets the cancer slope (aka cancer potency).

To determine the concentration whereby you do not need to be concerned - the Not Significant Risk Level (NSRL) - and therefore are not required to notify the public that you have a substance "known to the state to cause cancer," you take the cancer slope value and you plug it into the formula below:

q(human) = cancer potency = cancer slope factor
Let's see how this works for a chemical called 4-methylimidazole. California has a nice document that spells out the Cancer Slope Factor (Cancer Potency) and the NSRL that was calculated using the formula I showed above.


California was nice enough to show their work for 4-methylimidazole so you can see how the NSRL was determined:
Source

You see that value of 16 micrograms in Table 1. You see the Cancer Potency in Table 1. You see the calculation for the NSRL in Table 1. You see the work, the formula, the values.

Can we agree on this as this is how you calculate the NSRL? 

You may be wondering why I am not using the same snip graphics from the California document for acrylamide.Well, that's because they don't show the work. Here is Table 1 for acrylamide:

Source

This looks just like Table 1 for 4-methylimidazole. You will notice that they give the NSRL for acrylamide as 1.0 micrograms per day.

Wait, I have been telling y'all that the NSRL for acrylamide is 0.2 micrograms per day. Where did that 0.2 number come form? It came from their webpage:


I want y'all to know I don't make these numbers up. One of the reasons it take 7 to 10 posts is because I want to make sure the numbers presented are the numbers given.

So what is the NSRL for acrylamide? Is it 1.0 micrograms per day or 0.2 micrograms per day? What does the calculation for the NSRL show?

Source

Oh look! They did not show their work. Okay, I'll just calculate it myself using Excel:


Well, according to my calculation using their formula and their Cancer Potency value, the NSRL is 1.0 micrograms per day.


Let me make sure my calculation is calculating correctly. Ill use the values for 4-methylimidazole to see if I get what they got:


Okay, so my Excel formula works correctly. So where did a an NSRL of 0.2 micrograms per day for acrylamide come from?

The document from which these number came from that I plugged into my Excel formula is dated March 2005. These documents are how the state supports the numbers for the chemicals "known to the state...."  The "INITIAL STATEMENT OF REASONS" - also dated March 2005 gives the same cancer potency and NSRL of 1 microgram per day.


According to Title 27 for the California Code of Regulations §25705 "Specific Regulatory Levels Posing No Significant Risk" the NSRL is 0.2 micrograms per day.


It appears that, by citing 25705(c):
NSRLs may be based on: an assessment conducted by another state or federal agency (Section 25705(c)). (source)
Okay, then what is the March 2005 document all about? If they calculated the NSRL using a different Cancer Slope Factor (aka Cancer Potency), then where is the supporting data? Where did 0.2 micrograms per day come from?

Show your work!

Everything involving this court case, all the news articles, all the bloggers talking about it use 0.2 micrograms per day for the NSRL. Why? because that's the number that appears on the California Proposition 65 website for NSRL values.


Way back in 1992 this document had the Cancer Potency for acrylamide as follows:


Maybe they changed the Cancer Slope Factor (aka Cancer Potency) from 0.7 in 2005 to something else in 2018? Let's check the California Website for acrylamide to see:


Source


Wait...that oral slope factor is the one they used in 1992. Ahhh...I think I may know what happened. I think they got their apples mixed up with their oranges. Is it possible to have the same Cancer Slope for an inhalation dose and an ingestion dose? My thinking seems to be supported by this:
Historically, toxicity concerns over acrylamide centered on worker health and safety, primarily for neurological, male reproductive and cancer effects. However, in 2002 it was discovered that acrylamide can form during the cooking of starchy foods at high temperatures. This unexpected discovery shifted the concern for health risks to the public from acrylamide in the diet. Since 2002, acrylamide has been discovered in many plant-based foods that have been baked or fried at high temperatures. (source)
It appears though that this new look, March 2005, was not adopted into regulation so it still stands that the NSRL for acrylamide is 0.2. It should be, based on data - no lower than 1 micrograms per day as pointed out at the beginning of this post.

Now we can go all the way back to my first post on this. Is 0.2 micrograms a "real" number? Again, ya' gotta know that number because what ever that number is, above it presents a significant cancer risk according to California.

If 1 micrograms per day is a "real" number - or closer to the real number for a risk above one in 100,000 - then that Short cup of coffee - at 0.66 micrograms of acrylamide per cup - no longer poses a "significant risk" for cancer...based on how California looks at it.

This is why that writing in blue in the graphic at the top of the page is so critical to remember. millions of dollars are wasted over these NSRLs. It appears to me that the 0.2 micrograms per day established for acrylamide is wrong. legally it is correct, but calculation wise it is wrong.

Now add in the fact that the Cancer Slope Factor is derived by forcing the line from which the slope is determined mathematically, is assumed to begin at 0 risk and 0 dose.

Having fun yet?


Next Post: Coffee, Acrylamide, and Proposition 65 - Part 8

Coffee, Acrylamide, and Proposition 65 - Part 6

California contends that any product consumed that has less than 0.2 micrograms of acrylamide can be considered as presenting no significant cancer risk.

Cool...

Now let's look at Starbucks et. al. They sell a cup of coffee in California. Coffee, we are told, contains the chemical "acrylamide," and acrylamide is known to the state to cause cancer.
Scientists believe the acrylamide in food is a product of the Maillard reaction. This reaction occurs when sugars and amino acids are heated above 248° F, or 120° C. (Source)
Okay...

With that knowledge, a couple of things come into play. First, because the acrylamide shows up as part of the process in roasting the coffee, it does not meet the definition of "naturally occurring" (and therefore can be ignored.) Second, we are told that a product that contains less than 0.2 micrograms of acrylamide presents no significant cancer risk.

How much acrylamide is in a cup of coffee?
One single cup of coffee (160 ml) delivered on average from 0.45 micrograms acrylamide in roasted coffee to 3.21 micrograms. (Source)
Starbucks sells coffee in  Short (8 oz.), Tall (12 oz.), and Venti (20 oz.). 160 ml is equal to 5.4 ounces.

the smallest dose that we can get from Starbucks then is an 8 oz  cup.

So...we can assume there are 0.45 micrograms per 5.4 ounces or 0.08 micrograms per ounce.

Which means the smallest dose of coffee from Starbucks - a Short - contains 0.66 micrograms of acrylamide. That's 3 times more than the amount that California states presents no significant cancer risk.

This means that drinking a Short cup of regular Starbucks Coffee jumps from a one in 100,000 cancer risk to about three in 100,000.

Or, if the background chance of cancer in a lifetime for a population is 25% - one in four - then drinking one Short  cup of regular coffee from Starbucks - each day - for 70 years - jumps your chance of cancer from 25,000 per 100,000 up to 25,003 per 100,000.

That number - 25,003 is three additional cancers in a lifetime - 70 years - over a background of 25,000 cancers we expect to see - estimated from drinking a Short (8oz) cup of Starbucks everyday for 70 years. Hey, its possible.

That number - "three additional" - is only "real" if the math is correct. And therein lies the problem with all of this. Is the "three additional" not just probable, but even possible?

California tells us that:
The Proposition 65 “no significant risk level” (NSRL) is defined in regulation as the daily intake.
We discussed this in a previous post. The NSRL is the daily intake for which California tells us presents no significant cancer risk. It is the amount that our calculation tells us would present no more than one additional cancer in a 70 year lifetime per 100,000 people.

Where am I going with this? Let's look at what we are faced with when we look at acrylamide in something we consume. There will be a:
  • Concentration that gives us one additional cancer is a "No Significant Risk Level - NSRL
  • Concentration that gives us two more cancers, for a total of three, is a significant risk level and requires notification.
Up to 0.2 micrograms of acrylamide in your coffee is okay - no notification - no significant risk.
But once you exceed 0.2 micrograms in one cup sold, then you need to be notified of the risk.

The problem here is that California does not look at this risk in any form of degree. Once you exceed the NSRL you present a significant risk. Three in 100,000, 300 in 100,000, 30,000 in 100,000...are all looked at the same.

The question that I ask is this: Is the public better protected knowing that the acrylamide in a Short cup of coffee presents a three in 100,000 cancer risk? If a cancer risk of one in 100,000 presents "no significant cancer risk," then how much concern should there be when you jump to three?

And since we are so close in what is present and the NSRL, how confident are we in that number that claims no more than one additional cancer in 100,000? The difference between notification and not having to notify is a big deal for a company that sells food.

If you are going to spend time going to court and printing up notices, and working to convince the public are product is safe, then the number 0.2 micrograms per day had better be a real number.

Is it?

How did they come up with that number, 0.2 micrograms per day?

I'll show you...


We are going to spend the next post or two looking at the math. To get to 0.2 micrograms we had to know the cancer potency. What is that? Here is what California states:
Cancer potency factors may also be referred to as “cancer slope factors”. 
Once we know the cancer slope - the cancer potency - we plug it into that formula and it spits out the NSRL. 0.2 micrograms was derived from a cancer slope that was determined by forcing the line through the data so that zero dose = zero cancer risk. Right out of the box. we now no that the cancer slope is not a real number. It is a number that we agreed on because someone said at some time that any exposure presents a cancer risk.

So here we are in 2018 using that same line of thinking even though a lot of us think its wrong and carcinogens behave similar to non-carcinogens and not a straight line - linear - for 0 dose/0 risk.

To get to the NSRL of no more than one in 100,000 additional cancer risk, you need to calculate the cancer slope (cancer potency).

Let's have some fun shall we?


Next Post: Coffee, Acrylamide, and Proposition 65 - Part 7

Monday, May 21, 2018

Coffee, Acrylamide, and Proposition 65 - Part 5


In the case of acrylamide in coffee, how do we establish there is a "significant amount" of acrylamide "in the products they purchase?"

Based on what we know so far, California has established a "Safe Harbor" concentration of 0.2 micrograms per day. Any thing that is at this concentration or less in the "products they purchase" would never have to be disclosed.

That is, California has determined that your need to be warned ends when the concentration of the chemical presents a cancer risk of less than one additional cancer in 100,000. Less than 0.2 micrograms that would be consumed when using the product, would not require the warning:
“This product can expose you to a chemical [or chemicals] known to the State of California to cause cancer."
let's make sure we are all clear on this. 0.2 micrograms presents a cancer risk that California tells us that y'all don't need to worry yer perduy lil' head about this here chemical. Which means we go back to that proverbial line in the sand...


That line - threshold - for acrylamide is 0.2 micrograms per day. We don't say that less than 0.2 micrograms is "safe" what California claims is this:
...such chemical shall be deemed to pose no significant risk within the meaning of Section 25249.10(c) of the Act.
Section 25249.10(c):
 An exposure for which the person responsible can show that the exposure poses no significant risk assuming lifetime exposure at the level in question for substances known to the state to cause cancer...
So on the "Safe" side of the line in the sand lies acrylamide at a 0.2 micrograms/day concentration that "pose no significant risk."

Which means what for the other side of the line? If on one side it poses "no significant risk" does the other side of that line therefore pose a "significant" risk? If less than one in 100,000 is "no significant risk", is 1.01 in 100,000 a "significant" risk? What about two in 100,000?

Oh what a corner Proposition 65 painted us into.

This now requires us to get back into some math. That risk calculation of one in 100,000, or 1.01 in 100,000, or 2 in 100,000 is calculated based on that linear line we have discussed. Remember, that line is forced so that zero dose = zero risk.


Let's look at a recognized definition of cancer risk:
A slope factor is an estimate of a chemical’s carcinogenic potency, or potential, for causing cancer. If adequate information about the level of exposure, frequency of exposure, and length of exposure to a particular carcinogen is available, an estimate of excess cancer risk associated with the exposure can be calculated using the slope factor for that carcinogen.
...an estimate of excess cancer risk can be calculated...
 Specifically, to obtain risk estimates, the estimated chronic exposure dose (which is averaged over a lifetime or 70 years) is multiplied by the slope factor for that carcinogen.
So that number of 0.2 micrograms per day for acrylamide was determined as the dose that would get an “excess cancer risk” of one cancer above the background chance would appear in a population of 100,000 people.

Here is how the ATSDR guys define it for a cancer risk of one in 1,000,000:
Cancer risk is the likelihood, or chance, of getting cancer. We say “excess cancer risk” because we have a “background risk” of about one in four chances of getting cancer. In other words, in a million people, it is expected that 250,000 individuals would get cancer from a variety of causes.
This is a bit misleading here. Acrylamide risk is based on cancer from acrylamide exposure. We would need to know the background risk of the cancer associated with acrylamide. However, this still works as they are telling us that if you did not drink coffee your chance of cancer is 25,000 in 100,000. If you drink coffee with 0.2 micrograms each day, for 70 years, your chance of cancer is 25,001 in 100,000.

Here is how the ATSDR explains it based on the one in 1,000,000 cancer risk:
If we say that there is a “one in a million” excess cancer risk from a given exposure to a contaminant, we mean that if one million people are exposed to a carcinogen at a certain concentration over their lifetime, then one cancer above the background chance, or the 250,000th cancer, may appear in those million persons from that particular exposure. In order to take into account the uncertainties in the science, the risk numbers used are plausible upper limits of the actual risk based on conservative assumptions. In actuality, the risk is probably somewhat lower than calculated, and in fact may be zero. [ATSDR]
Here is what that calculation looks like for determining the Safe Harbor NOEL for a chemical "known to the State of California to cause cancer." This is how 0.2 micrograms per day for acrylamide was calculated. Note: The term "potency value = slope factor.


Now that we have that out of the way, let's look at the calculated cancer risk that California would claim is in one delicious cup of Pikes.


Next Post: Coffee, Acrylamide, and Proposition 65 - Part 6

Friday, January 4, 2013

The Village of DePue: The ethics of drawing a line - Part 11

Looking at the 125 samples collected in OU-4, I found that a number of them exceed the level of concern.

Arsenic, in particular, creates the most problem for establishing a "safe" level at which to leave the soil in OU-4.  Because OU-4 is the area where exposure can take place.

The problem with arsenic is not the poison part we all associate it with, but instead our knowledge that it may cause cancer at low concentrations.

The problem with contaminants that are suspected to cause cancer is that we are told:
The underlying presumption for carcinogens is that the introduction of even one molecule of the contaminant can cause cancer in an individual even if the probability is very low. This conservative, “non-threshold” concept is used because it is presumed that there is no level of exposure to a carcinogen that does not pose a certain level of risk.
That's from Illinois' TACO's Fact Sheet.  That statement is one of the presumptions we hold as true when we look at risk of exposure to a chemical.

You can see the bind that puts us in.  If we say exposure to "even one molecule of the contaminant can cause cancer in an individual" setting a "safe" concentration is, well, not possible.  Instead we draw a line in the sand and say:


You see how they put us risk calculating types between a rock and a hard place?  For exposure to a contaminant in soil, I have to come up with a concentration that theoretically will show no more than one excess cancer per 1,000,000.  That number, based on what we know today, is calculated to be no more than 0.39 mg of arsenic in a kg of soil (0.39 mg/kg).

Now there is no way on God's green earth that you will ever find soil at less than 0,39 mg/kg of arsenic.  Arsenic is a naturally occurring element.  It is everywhere.  Because it is everywhere, we are constantly exposed to it.  In this case, we cannot reasonably ask that soil be cleaned up to a standard lower than what good ol/ mother nature has exposed us to.  So we settle on a background concentration as our cleanup objective.

According to the regulations in Illinois (742.Appendix A, Table G) the background for arsenic in soil at 11.3 in non-metropolitan areas.  Therefore, we are now going to live with this:


But this creates a sense of foreboding when the levels exceed background.  What is the probability of added risk?

In OU-4 there are 98 samples out of 125 that are at or above the background concentration of 11.3 mg/kg arsenic.  The spreadsheet provided by Cleanup DePue shows the average amount of arsenic in OU-4 to be 19.6 mg/kg of arsenic.

Now anyone can see that 19.6 is higher than 11.3.  Does that constitute a "way-above-normal concentrations?"

As I discussed in my last post, what we need to look at is the amount of exposure above normal.  In this case, on average, the soil in OU-4 is 8.3 mg/kg higher in arsenic than the regulatory background limit.

If, and this is a big if, a citizen of DePue is exposed to that soil for 350 days a year for 70 years, by my estimate, that would bring about a probability of 1.8 excess cancers in 10,000.

Now anyone can see that a probability of 1.8 in 10,000 is much higher than 1.0 in 1,000,000.  But that probability of 1.8 in 10,000 is based on coming in direct contact with the soil and having the arsenic in that soil enter into the body.  You must also have that happen each day for 350 days a year for 70 years.  It is also based on a theoretical slope factor that we guestimate will show cancer at a particular concentration.

So how close is that added probability of 1.8 excess cancers in 10,000 to what might actually happen?  Possible?  Maybe.  Probable?  Not even close.

That puts me between a rock and hard place.  One one hand I accept the "even one molecule of the contaminant can cause cancer" presumption and on the other I can soundly state that ya' got nothin' to worry about in OU-4.

And here is where it get's all ethical on us...or at least for me.
  • If I accept the "even one molecule of the contaminant can cause cancer" presumption then exposure to any molecule above zero presents a risk.
  • If I accept one in one million as being an acceptable level of risk, then I accept as "safe" a concentration that will not present a risk of no more than one excess cancer in one million as my threshold.
  • If I accept the premise that arsenic - like chromium, cadmium, and lead - are naturally occurring in the soil, then I must accept the fact that I will always be exposed to some concentration of those contaminants when I come in contact with soil.
  • If I accept that there is a concentration of contaminant in the soil that is low enough to be considered "safe" then my responsibility to cleanup my mess will end when that threshold is met.
That last one is the premise of "how clean is clean?"  Since we are concerned about a risk of acute and chronic health problems because of our exposure to the soil in OU-4, we must draw a line in the sand and say on this side it is clean.

That side is determined by doing a risk assessment.  Apparently, Nancy Loeb, the director of the Environmental Advocacy Clinic at Northwestern University School of Law’s Bluhm Legal Clinic, has told the folks in DePue that this risk assessment is flawed:
“The companies spent millions of dollars on consultants in an attempt to show that this SuperFund site poses no significant risks, and they delivered a superficial plan that barely touches many of the contaminated areas, leaves the slag pile and other waste in place, does nothing to stop contamination from seeping into the groundwater, and leaves backyards, playgrounds and Lake DePue without real remediation.”
Ms. Loeb claims that the "safe" line is not set low enough.  She offers no calculations or explanation to support that claim, but, nonetheless, that's her contention.

I am going to look for this plan that she speaks of to see what those cleanup levels and remediation methodologies are to see if they are indeed lacking.

Right now, all I have is a bunch of data that shows an average concentration of arsenic in the soil in OU-4 to be 8.3 mg higher than the legal background concentration established by Illinois in  742.Appendix A, Table G.

Regardless of what I think the true risk is.  Regardless of whether or not 8.3 is to be considered "way-above-normal," the one fact that remains is this.  If I am going to draw a line in the sand that says "clean" then I must do something about the soil that has a concentration above that threshold.

I need to see what is proposed for OU-4.  In particular, I need to see how they are addressing arsenic above background.

Ethically, if I use a concentration to make the statement of clean soil, then I have a responsibility to do something about soil that falls above that level designated as "safe."  I have an obligation regardless as to whether or not the soil above that line presents a risk or not.

This is the double-edged sword we live by.  If I draw a line in the sand to say "safe" and therefore my responsibility is ended, then I have an ethical responsibility to rectify those areas that are above that threshold.

Since Illinois has stated that background may be used as a cleanup objective, anything above background must be remediated.  This is the ethical contract we must adhere to if we are to use the benefit it provides in establishing a level of "safe."  If my responsibility can be terminated at a particular concentration, then ethically I need to be responsible for areas above that.  I cannot accept background when it suits me and discount it when it does not.

Ms. Loeb seems to indicate that the bar of what is "safe" has been moved to allow for exposure to higher concentrations then she thinks is "safe."  What I need to see is how the soil screening levels are being calculated and what constitutes a "safe" concentration.

At this point, 98 samples are above background concentrations for arsenic in OU-4.  The Illinois regulators have drawn a line in the sand and said that background is an appropriate cleanup objective.

Is that legal background concentration in 742.Appendix A, Table sacrosanct?

If we have an ethical duty to reduce the risk for the people living, working, and playing in OU-4, then establishing what a "safe" level of exposure is becomes critical.  This, if I had to guess, is the main sticking point with Ms Loeb.

Not sure if I can get a hold of that information, but I am going to start looking.


Next post: The Village of DePue:  What's in store for OU-4 - Part 12

Wednesday, January 2, 2013

The Village of DePue: Theoretical Cancer Risk at Background - Part 10

The theoretical cancer slope factor (CSF) that has been set for Arsenic is 1.5 (mg/kg)/day.

So...theoretically:
  • The soil screen level that will achieve a risk of one additional cancer in one million for arsenic is 0.39.
  • A person exposed for 350 days a year, for 70 years, to 0.39 mg/kg of arsenic in soil would have a 33.3334 percent chance of getting cancer in their lifetime
  • A person not exposed to 0,39 mg/kg of arsenic in soil will have a 33.3333 percent chance of developing cancer in their lifetime.
  • The difference is 0.0001 percent or a probability of 0.000001 (1 in a million)
This is how we look at chemicals suspected to cause cancer.  There is no "safe" dose, so we calculate the risk based on a chronic exposure to a set amount.

We feel that one in one million is an acceptable risk and the amount of arsenic in soil that would be expected to produce the chronic daily intake (CDI) necessary to show a one in one million risk is 0.39 mg of arsenic per kg of soil.

All of this is theoretical.  But for purposes of setting a cleanup standard, it is the best we have so we will make the assumption that 0.39 mg/kg is the "safe" limit.

That, as we discussed in a previous post, is a value that is unable to be obtained in nature.  That is, there is a natural amount of arsenic that we are exposed to.  We call that "background" and it is set based on what we "normally" see in places where we live.

Illinois has set the background for arsenic in soil at 11.3 in 742.Appendix A, Table G.

11.3 is quite a bit higher than the theoretical "safe" value we want which is 0.39 mg/kg.

There is nothing we can do about background, so we ignore the theoretical what we want, and accept the background as "safe."

So...11.3 mg/kg is "safe."

In OU-4 we have 102 samples that exceed the background concentration that Illinois has said is acceptable.

What do those exceedances  mean in terms of additional risk?

Let's look at this from EPA's Integrated Risk Information System (IRIS) perspective:

IRIS
IRIS shows that the concentration of 0.02 μg of arsenic per liter of drinking water is the "safe" amount that will increase the risk of cancer from 33.3333 to 33.3334 percent.

If you increased the concentration 100 fold, from 0.02 μg to 2.0 μg per liter of water, the risk would move from 33.3333 to 33.3433 percent.

100 times more arsenic consumed increases the risk from 33.3334 percent to 33.34 percent.

Okay, so what does this mean for the people who live in DePue?  It depends on how one wants to look at it.

First off, the slope factor used to calculate the risk is very conservative which means it most likely over-estimates the risk.  Second, the amount of arsenic that enters into the body from soil fluctuates wildly.  Our calculations of how much are based on a consistent amount of arsenic entering into the body 350 days a year for 70 years.  Third, we are looking at excess cancer above and beyond the one in three chance of getting cancer in a 70 year lifetime.

But let's ignore all of that and focus solely on establishing a threshold where on one side it is "safe" and on the other side there is "risk."


The Illinois background level for arsenic has been set at 11.3 mg/kg.  This level is a cleanup objective that Illinois assumes presents a "safe" environment if the arsenic is at or below that amount.

For all intents and purposes, we will assume 11.3 or less to present no excess cancers above the norm of a 33.3333 percent chance of getting cancer in a 70 year lifetime.

That assumption means, theoretically, that exceeding the value of 11.3 presents an additional risk.  So...how much are we talking about?

The average exceedance of the background threshold of 11.3 mg/kg was 1.7 times the background for an average amount of arsenic in the soil in OU-4 (where the people live) of  19.6 mg/kg.

19.6 mg/kg exceeds the threshold of 11.3 mg/kg by 8.3 mg of arsenic.  So...8.3 mg of additional arsenic exposure is what we will estimate the additional cancer risk on.

Here is where it gets fun.

The EPA's soil screening level (SSL) for arsenic is 0.39 mg/kg.  0.39 mg of arsenic in the soil is assumed to present a risk of no more than one additional cancer in one million cancers for a person exposed 350 days a year for 70 years.

EPA's IRIS has calculated the chronic daily intake (CDI) for arsenic to be 0.02 μg of arsenic per liter of drinking water for a risk of one additional cancer in one million cancers  .

Since the average person is assumed to consume 2 liters of water per day, the amount of arsenic that will theoretically bring about a risk of one additional cancer in one million is 0.04 μg per day for 70 years.

So...we can assume that exposure to 0.39 mg/kg of arsenic in soil, for 350 days a year, for 70 years, will equate to a CDI of 0.04 μg of arsenic.

0.04 μg of arsenic.consumed each day for 70 years will theoretically result in no more than one additional cancer in one million.

0.39 mg/kg exposure = 0.04 μg of arsenic consumed.  That's our line in the sand.

On average, in OU-4, the soil exceeds background by 8.3 mg of arsenic per kg of soil.

Okay...take a break and relax.  Here is a picture of a kitten and a puppy to help...before we do more math and take on more assumptions.

Source
Feeling better?  Okay, let's continue.

8.3 mg is 21 times higher than 0.39.  Therefore, the CDI at 8.3 mg of arsenic exposure would - theoretically - be 21 x 0.04 = 0.84 μg of arsenic consumed.  That's based on the SSL calculations the EPA used.

So what is the risk of consuming 0.84 μg of arsenic per day for 70 years?

In my previous post I showed this calculation:

Source
Here is what we know:
  • The NSRL is the uptake - 0.84 μg which is equal to 0.00084 mg
  • The the slope factor (qhuman) is 1.5 (mg/kg-day)-1
  • The body weight we use is 70 kg.
Basic algebra here with the math.  We need to solve for the risk "R"

(0.00084 x 1.5) / 70 = 0.00018 or 1.8 excess cancers in 10,000.

Here is what the TACO's fact sheet says about that:
The risk of cancer due to exposure to a contaminant is commonly expressed in exponential terms, e.g., 10-6 and 10-4. These terms equate to a risk of 1 in 1,000,000 and 1 in 10,000 respectively. Adding a 10-6 risk would increase the probability of an individual getting cancer to 0.333334. With the addition of a 10-4 risk, the probability of an individual getting cancer would be 0.333433.
On average, in OU-4, the probability of an individual getting cancer would be 0.333453.

What that means is one's normal probability of cancer in a life-time of 0.333333 becomes 0.333453 if exposed to that soil for 350 days a year for 70 years.  This is based on contact with the soil so that the soil enters into the body.

Although it is possible, it is highly improbable that any one in DePue would have an uptake of soil over a lifetime that would equate to a risk of 1.8 excess cancers in 10,000.

Based on how conservative these formulas are, and how theoretical the slope factor is, I do not see any reason to be concerned about the amount of arsenic in the soil in OU-4.

But that raises and ethical question.

Should the citizens of DePue be exposed to any risk above one in one million?


Next Post: The Village of DePue:  The ethics of drawing a line - Part 11

.

Friday, December 28, 2012

The Village of DePue: By how much and how many - Part 9

Tis the day after Christmas, and Excel sorting I will go....

Okay, it took me a few more days to get through all this....

In my last post I looked at the Illinois requirement for residential use which told me to meet Appendix B, Table A objectives.

Based on the data in the Excel files I downloaded from the Cleanup DePue website, six contaminants were found in OU-4 - the area where people have access to, that were above the Illinois cleanup objective concentrations in Appendix B, Table A.

I now need to sort the data to see by how many of them are over the objectives.  This, along with how much the exceedance is, will give me a good indication of risk.  I am only concerned with OU-4 because that is where exposure can take place.

Right now, I have a ton of data from soil samples collected in OU-4.  What I don't know is what the plan addresses.  What I do know is that the plan is much more complicated  in evaluating risk than what I am doing here.  What I am trying to do in these posts is make an assessment as to the claim of  "way-above-normal concentrations of pollutants at hundreds of contaminated sites" so don't go telling people "Bowman says you only need to clean it up to this level."

With that in mind, lets do some sorting...

Ahh, but first we need to get some things out of the way first.
  1. csv_post_date is 1996 and 2009
  2. Thallium is identified as less then "<" a value.  Therefore less than 10 will mean it is below TACO Appendix B, Table A objectives.  I am removing thallium from the CoC list.
  3. Other values identified with "<" will be assumed to be the number below it.
  4. Only one sample exceeded the mercury objective of 23 mg/kg.  Since the analytical value is only 24.4 I am going to remove it from the CoC list.
Now that I have it sorted, of the 125 soil samples:
  • 102 exceed the objective for one of the chemicals, arsenic, barium, cadmium, or lead. 
  • Of these 102 OU-4 samples, all but five exceed the objective for arsenic, which is set at background.
  • Only two samples show exceedance for all four of the CoCs.
How, then, do I make sense out of this data?  That's what's missing from the Cleanup DePue's web site.  Tons of data and no context.  This is where I need to be careful in how I describe what I see.  I don't have access to the plan so I cannot speak on the validity of the risk calculations.  I also do not know what the remediation plan is for OU-4.  If they are going to leave the soil in place, well maybe these folks in DePue have something to beef about.  If these "hot spots" are going to be removed, then what I say from this point on is moot.

Oh how I wish I knew what Cleanup DePue and Nancy Loeb, director of the Environmental Advocacy Clinic at Northwestern University School of Law’s Bluhm Legal Clinic and pro-bono counsel for the Village of DePue want.  All I know is they think the plan insufficient to protect them.

The other thing missing from their site is what cleanup levels do they think are health protective and what areas do they want these levels met?  I have been writing these previous posts trying to answer my own curiosity about "way-above-normal concentrations of pollutants at hundreds of contaminated sites"

My problem is that I don't know what they construe as "way-above-normal concentrations."  I am missing some important pieces here.  Since I don't now how the remediation plan is addressing the soil in OU-4, I can only look at what I see from the sample data that I have.

Right now, arsenic is where my focus is because of the number of OU-4 samples where it exceeds the threshold - or cleanup objective in Section 742 Appendix A, Table G.

What I see when I sort the OU-4 soil sample concentrations is that arsenic shows up like this:
  • 27 of the samples are more than twice background
  • Two samples are three times background (3.0 and 3.3)
  • One sample is 4.2 times above back ground
  • The average exceedance is 1.7 times background with a median exceedance of 1.6.
Depending on how one looks at it, twice the amount could be seen as "way-above-normal concentrations of pollutants at hundreds of contaminated sites."  Unfortunately, that's not how it works out in this case with arsenic.

Arsenic is set at background because natural background concentrations of arsenic are often well above the health-based, direct-exposure goals in soil.  That's a bit confusing.  On one hand you tell me the "safe" concentration in soil for arsenic is 0.39 mg/kg and then you tell me you only need to clean it up to background.

Yeah...that's what we are telling you.  Our health-based cleanup goals (objectives) are theoretical erring on the conservative side.  Because we suspect arsenic to be a human carcinogen, we set the acceptable risk for an adverse health affect to no more than one additional cancer out of one million cancers.

I'll let TACO's explain that:
For carcinogens, risks are estimated as the probability of an individual developing cancer over a lifetime as a result of exposure to a contaminant.
What we are looking at is a probability of cancer, in the case of soil, we set that probability of a "safe" level at a concentration that we expect to see no more than one additional cancer out of one million cancers over a 70 year lifetime.  We do this with a calculation involving our good friend the slope factor:
This value is known as a slope factor (SF), and it converts daily intakes of a carcinogen averaged over a lifetime directly to the upper bound risk of an individual developing cancer.  That is, risk is equal to chronic daily intake (CDI) averaged over 70 years (lifetime) multiplied by the SF. (page 4 of TACOs)
Figuring out the dose that will give you no more than one additional cancer in one million is quite simple:

Calculating how low a concentration of a contaminant needs to be in soil to bring about that dose is a bit more complicated.  For risk, we are assuming that ingestion, dermal contact, and inhalation of dust for getting the chemical into to human receptor.  We know that as little Suzy grows from a toddler to an adult she will come in contact with that contaminated soil.  We assume that little Suzy will be in contact with that soil for some period of time each year for 70 years (default is 350 days/year).  We know, through a bunch of different studies, that people like little Suzy and adult Suzy will ingest a certain amount of soil in a day.  The question becomes how much contaminant in that ingested soil needs to be there to bring about a probability of one additional cancer in a million.

Remember this bad boy calculation?

That's how it is calculated.  When you see "IFS" it is "age-adjusted soil ingestion factor." DFS is the "age-adjusted soil dermal factor."  These formulas take into account the differences in body weight and uptake as little Suzy goes from a toddler to an adult.  They are very, very conservative and very, very protective.

So for arsenic, the amount in soil that will bring about no more than a one in one million probability of an additional cancer is 0.39 mg of arsenic per one kilogram of soil.  Why show y'all this?  Because that's how we come up with a "safe" threshold for a contaminant we suspect to be a carcinogen.  You need to see that in order to understand the next part of the calculation.

If little Suzy is exposed to 0.39 mg of arsenic in one kilogram of soil for 350 days a year for 70 years, we expect her to have a one in one million chance of developing cancer.  This is a probability based on assumptions which are all worst case.  The biggest assumption is the Slope Factor (SF or CSF):
The SF is derived through the plotting of a curve that compares dose to response. Statistical procedures usually calculate the SF as the upper 95th percent confidence limit of the slope of the dose-response curve (i.e., there is only a 5% chance that the cancer risk could be greater). Because this is the upper bound risk, the actual risk is between that value and zero. The SF is roughly equivalent to the risk per unit dose, expressed as (mg/kg/d)-1. As with the RfD, the SF is provided by the U.S. EPA. (page 4 of TACOs)
And what is the SF provided by the EPA for arsenic?  1.5 as it stands today.  With that, we can calculate the chronic daily intake (CDI) for arsenic to get us a one in one million risk probability.  We can use the method described in the California equation above:
  • We know the risk (R) we want is one in one million or 1.0 x 10⁻⁶ or 0.000001.
  • We know the slope factor (qhuman) is 1.5 (mg/kg-day)-1
  • We know the average weight of the human is 70 kg
So, a little math...and we can calculate the intake level (I) or CDI
I = (0.000001 x 70 kg) / 1.5 mg/kg-day = 0.000047 mg/day or 0.05 μg/day.
0.05 μg of arsenic consumed for 365 days a year for 70 years should see no more than one additional cancer per one million cancers.  What does that mean?  Here is how Illinois describes it in the TACO's Fact Sheet:
The risk of cancer due to exposure to a contaminant is commonly expressed in exponential terms, e.g., 10-6 and 10-4. These terms equate to a risk of 1 in 1,000,000 and 1 in 10,000 respectively. In the benzene example, the risk estimate of 1.5 x 10⁻⁵ means that 1.5 additional cases of cancer above background might occur among 100,000 exposed persons (or 15 cases in 1,000,000 persons) as a result of benzene exposure. The background cancer rate is 1 in 3, meaning that over a lifetime, an American’s probability of getting cancer is 0.333333. Adding a 10-6 risk would increase the probability of an individual getting cancer to 0.333334. With the addition of a 10-4 risk, the probability of an individual getting cancer would be 0.333433.
Confused?  Focus on the numbers here:

The slope factor is a value that is a very conservative number.  It is very, very protective of public health in and by itself.
  • The probability of cancer risk is based on a CDI of that concentration of arsenic each day for 70 years.
  • The probability of consuming that amount over 70 years and getting cancer is one in one million.
  • The chance of getting cancer in your lifetime is one in three - 33.3333%.
  • If we expose you to soil with 0.39 mg/arsenic per kg of soil for 350 days a year for 70 years, the chance of getting cancer increases to 33.3334%
Now if you have stayed with me to this point, you might be asking "what is the risk of cancer at the background concentration of arsenic?"

Good question.

Next post: The Village of DePue:  Theoretical Cancer Risk at Background  - Part 10


Monday, October 10, 2011

Laundered Shop Towels: 14 - Should you believe them?

In my first post on this topic I asked:
Should we accept it based on the reputation of Gradient and the credentials of the three authors?  Or should we look deeper into the study to see how they came up with data that affords Kimberly-Clark the ability to ask workers: Why risk it?  Who's counting on you?
I then went on to say:
Well I have looked into it.  I can support my conclusion that there is no additional risk to a worker using a laundered shop towel.  Period.  Should you believe me?  No, not until you read what I am putting forth as my reasons why this study is flawed and their conclusion false.
So here we are after 13 posts on this topic.  I have presented how Gradient came to conclude that there is a risk

Kimberly-Clark sure wants to take Gradient's findings at face value.  What business wouldn't want to show how bad the other option is by claiming:
"Two studies conducted during the last 8 years show that laundered shop towels contain toxic heavy metals even after laundering." (1)
And they get to do that with unabashed glee simply because of a study prepared interdependently by:
"an environmental and risk science consulting firm renowned for their expertise in Toxicology, epidemiology, Risk Assessment, Product Safety, Contaminant Fate and Transport, and Environmental/Forensic Chemistry." (1)
But those ratios Gradient reports in Table 8a have a much different meaning when you look at how they were generated as well as what the comparison is made to:

Let's look at each one of my issues with their model, calculation, and assumptions.  If there is an increase in risk high enough to warrant discontinuing the use of laundered shop towels, it must be supported by the science presented in Gradient's reports.

Gradient claims that the average concentration of lead (the metal with the highest exceedance ratios -Table 8a) in laundered shop towels is 100 mg/kg.  If that average is not correct, then none of the intake values they calculated are correct.

Based on the minimum and maximum concentrations they present in Table 4 of their study, and the standard deviation reported, it is evident that the average Loads they use are skewed to represent a higher concentration of metals than would naturally be found.

The calculated mean - or average - is supposed to represent the true mean of the population.  Based on the high variability in the concentrations they report (as shown by the standard deviation exceeding the mean) it is highly unlikely that the averages they used to determine the Load represent what is actually found on a laundered shop towel.  It is, in most likelihood, magnitudes higher than what would normally be found.

Let's look at an example to illustrate this:


Here are 25 values representing the lowest concentration detected (1.7) and the highest (600) for lead.  All the other numbers are just numbers I came up with.  The numbers in blue represent all the values less than the mean, the numbers in red represent concentrations higher than the mean.  Using these numbers I was able to get close to the mean and standard deviation reported by Gradient.

Since 100 mg/kg is the number Gradient uses to estimate the lead Load on the laundered shop towel, if these were the actual values detected, 22 towels encountered would have a concentration of lead on them less than 100 and three would be above.

In a normal distribution, "100" would be the average encountered. so at the end of the day, after handling 12 shop towels, the load encountered would be around 100.  That's based on a normal distribution, where 100 is in the middle, half lower and half higher.  In my example 92% of the towels encountered have a lead concentration lower than 100.  See previous post on this topic.

I don't know what the actual concentrations for lead are, but I do know that the average of 100 is not a true representation of what is normally found on laundered shop towels.  It is too high based on the standard deviation reported.  This means that the Load for the towel they calculated is too high as well.

Even if the mean concentrations Gradient reports were correct, there is still the issue on whether or not the metals can be dislodged from the towel and onto the hand.  That's the whole purpose of calculating a Load, to see what is available to enter the mouth from the hand.  I discussed that issue in this post, and it is extremely relevant in determining the validity of their intake values.

The fact that an object may contain a high concentration of metals does not warrant concern if those metals can not be transported into the receptor, in this case from the hand into the worker's mouth.  In order for Gradient's model to hold true, metals must come off the towel and onto the hand - Tt/h.  Why Gradient did not look at what, if any, metals could dislodge from the towels is beyond me.  Even Adam and Jamie of the Mythbusters could have figured out a sound way to determine this.  And they're not PhDs!

So I'll call the "Load" and "Tt/h" part of Gradient's calculation:


But let's look at Load from a different angle.  Gradient claims that the intake of lead a worker might encounter on laundered shop towels is "11" times higher than the CalEPA NSRL for lead.  That is, the lead Load is significant enough to bring about 10 additional cancers for every 100,000 workers using laundered shop towels. (We would expect one cancer at the NSRL).  See previous post.

As I showed in that post, 100,000 workers would use 11.8 billion laundered shop towels.  Are you willing to contend that the 25 shop towels Gradient tested represent the Load on 11.8 billion towels?

Not only are the Load values Gradient used in question, but the intake they calculated requires the worker to place their hand to their mouth each time a laundered shop towel is used.  For these exceedance values to be true, a worker must bring their hand (single) to their mouth 117,600 times (12 towels, 245 day, 40 years).  And each time they bring their hand to their mouth, 13% of what is on the hand comes off the hand and is consumed.

Where did Gradient come up with that number of 13%? That number is half the amount of soil a child consumes if all of the soil consumed came from the hands.  Read my post on this for more information on how Gradient derived this.

Why Gradient chose to use a child's hand and not an adults when calculating this transfer efficiency can only be answered by them.  Had they used an adult's hand, the HTE would have been 6%.  But that's still based on a faulty premise that all of the soil consumed by the adult came solely from the hands.

A better - or more sound - method would have been to use CalEPA's hand to mouth calculation (see post). Once again, why Gradient made up their own method for deriving an HTE can only be answered by them.  It does seem odd though, that they would use CalEPA's MADL and NSRL thresholds and not their methodology.  Peculiar.

Based on this, I'll call the "HTE" part of Gradient's calculation "Busted" as well:


And what about Kimberly-Clark's claim:
"Just how far did they exceed these limits? Here’s one example: the study found that a worker using a typical number of shop towels per day can be exposed to up to 3,600 times the health-based exposure limit set for lead." (4th page)
What does that mean, "3600 times?"  That health based exposure limit is the CalEPA MADL for lead, and had Kimberly-Clark been more forthcoming, they would have let the worker know that the value CalEPA uses is based on health of the fetus and is set 1000 times lower than the no observable health effects level described in the literature.  See this post and this post.

What Gradient should have done was calculate potential exposure risk using EPA's method for determining the clean up level of lead in soil, which is also based on the health of he fetus (post).  EPA's "preliminary remediation goals (PRG) are based on the amount of lead intake from soil that would bring about a level of lead in the blood harmful to the fetus. At that blood level concentration of lead, Gradient's intake value exceeds the EPA 'safe" level by 3 times.  Using the more appropriate 6% HTE (based on an adult hand), the exceedance ratio is 1.3 - using all the other assumptions and values used by Gradient.  3600 times higher refers to a value used to determine when signage and notification is not required by a business.

So I'll call Kimberly-Clark's claim in their brochure:


There you have it.  I've shown you theirs...and I've shown you mine.

Should you believe Kimberly-Clark when they state:
Heavy metals have been found in laundered shop towels in amounts that exceed health-based exposure guidelines related to cancer and non-cancer related health issues, like reproductive and developmental effects.
Should we still conclude that laundered shop towels pose a risk to workers?

You have read my posts and can easily check my sources and work my calculations.  Here is what I think, based on what my research into this matter has shown me:


Which leads me to only one conclusion - Gradient's study and conclusion is....


Next post: Laundered Shop Towels: 15 - Why I spend the effort


.
