Saturday, May 21, 2016

Part 4: Preventing 7,000 deaths from heart disease alone among nonwhites each year

Clark et al at the University of Minnesota produced a research paper titled:
National Patterns in Environmental Injustice and Inequality: Outdoor NO2 Air Pollution in the United States
 They tell us in the abstract:
"For example, we estimate that reducing nonwhites’ NO2 concentrations to levels experienced by whites would reduce Ischemic Heart Disease (IHD) mortality by ,7,000 deaths per year..."
I have been looking at their data, and their claim of a 7,000 reduction in IHD deaths, in the last three posts.  In Part 3 I wrote this:
To me, this calculation of 7,000, or 6,579, or 5,638 is not within the realm of reality. Could NO2 contribute to 5,000 plus IHD deaths per year? Yeah...that's possible if Jerrett's RR of 1,06 is a direct result of an increase in NO2. [Bowman]
Here is what I come up with when I looked at their data.

Let's assume some things first.
  1. The relative risk for IHD with 4,1 ppb NO2 is 1.06.
  2. The incidence of IHD mortality is 109 per 100,000
  3. The population and concentrations for NO2 for 448 urban areas in the US as found in the Excel spreadsheet file "journal.pone.0094431.s001.XLSX" are valid.
  4. The column in that Excel file called "Difference Between LIN and HIW (ppb)" is a valid number.
I am writing this in "real" time, so from this point on, I have no idea what my way of calculating this is going to show.

To start, I needed to know what percent of nonwhites fall below the poverty line. That line seems to be consistent with what the Clark et al authors use for their "Low-Income Nonwhite (LIN) Population-weighted Concentration (ppb)"

I asked Google to get me this information and I found a reputable site with this information.

Next, I went looking in the Excel spreadsheet for the urban areas where the authors calculated a difference between the Low-Income Nonwhite (LIN) Population-weighted Concentration (ppb) and the High-Income White (HIW) Population-weighted Concentration (ppb) of greater than 4.0 ppb.

I chose 4.0 ppb to be consistent with the author's claim that "average NO2 concentrations are 4.6 ppb (38%, p,0.01) higher for nonwhites than for whites" and to be close to the relative risk of 1.06 reported by Jerrett et al for 4.1 ppb NO2.

Okay...I think I am being reasonable and fair here. Let's start.

Assuming that a 4.1 ppb difference in NO2 is associated with a 6% increase in risk for IHD mortality, what was the population of the 448 urban areas where the difference between the low income folks and the high income folks was greater than 4 ppb?

Time for another assumption. I am going to assume that the IHD morality is 109 per 100,000 for the white population in the HIW area.


This group of 12 urban areas represents a total population of 45.2 million people.

Let's do another assumption. Let's assume that within these 12 urban areas the percentage of nonwhites is 40%.

That would mean that the nonwhite population in these 12 urban areas where there is a difference of  at least 4.0 ppb NO2 between low income nonwhites and high income whites, is 18.1 million nonwhites.

Looking at the low income percentages provided by the Kaiser Family Foundation,
  1. 26% of Blacks are low income (26% of 18.1 = 4.7 million)
  2. 24% of Hispanics are low income (24% of 18.1 = 4.3 million)
  3. 15% of Other nonwhites are low income (15% of 18.1 = 2.7 million)
This equals a total of 11.7 million nonwhites living in areas where the difference between NO2 population-weighted concentrations for high-income whites and low-income nonwhites is greater than 4.0 ppb.

Assuming that there is a 6% increase in IHD mortality risk for 4.1 ppb NO2, a risk of 109 per 100,000 for high-income whites would rise to 116 per 100.000 for low-income nonwhites. There would be an additional 7 deaths per 100,000 for a total added deaths from IHD for these 12 urban areas of 823.

Using the same language as in the abstract:
Reducing low-income nonwhites’ NO2 concentrations to levels experienced by high-income whites in 12 urban areas would reduce Ischemic Heart Disease (IHD) mortality by 823 deaths per year. [Bowman]
For that number - 823 - to be correct, the relative risk for NO2 must be 1.06 for 4.1 ppb NO2 and the concentration of NO2 for 11.7 million nonwhites must be 4 ppb higher than for their white neighbors living in the same urban area.

Well that was a fun way to spend my vacation on Friday and this rainy Saturday.

To conclude...there will not be a savings of 7000 nonwhite lives if we lower the concentration of NO2 to that which whites experience. At best I calculate 823 and that number is based on a lot of assumptions all being correct.

Thanks for reading

Jeff


Part 3: Preventing 7,000 deaths from heart disease alone among nonwhites each year

Let's get into the press release statement once more:
Gap results in an estimated 7,000 deaths each year among people of color from heart disease alone
...is that number calculated correctly?

According to their paper, the relative risks in Ischemic Heart Disease mortality from increasing NO2 concentrations by 4.1 ppb is 1.066. This came from the 2003 paper by Jerrett et al.

Reading the Jerrett paper we are told:
All RR estimates are given over the interquartile range of each pollutant.
This value of 1.066 was calculated for the NO2 concentration values between Q1 and Q3


If you look at the Table in the Jarrett paper we see this:


Q1 therefore is the value for NO2 at 25% and Q3 is the value for NO2 at 75%.
Q1 = 10.21
Q3 = 14.33
The difference between Q1 and Q3 is 4.1 ppb.

The RR they calculated for 4.1 ppb is 1.066.

This would lead us to conclude that those who had NO2 exposure between 10.21 and 14.33  had a 6% increase in risk of ischemic heart disease IHD mortality.

Now for me, when I look at stuff like this, I try to look at it collectively. The mean - average - from the Excel file is at the Q1 value in the Jarrett paper.

What I see when I look at this data, is if the IHD is "109 deaths per 100,000 people," that rate takes into account this exposure range. And that value includes the deaths of whites and nonwhites.

The claim of Clark et al, is that "gap results in an estimated 7,000 deaths each year among people of color from heart disease alone."

That value of 7,000 deaths is based on the author's assumption that every nonwhite in the US lives in areas where the N02 concentration is at 14.5 ppb. This assumption - using the Jarrett data for California, places every nonwhite in the US in the forth quartile for distribution.

In other words, based on the Jarrett Table 2 data, 25% of the distribution of NO2 by population contains 100% of the nonwhite population.

That...that cannot be what the Clark et al folks are saying...or is it?

Follow me on my analysis here, just to make sure I am seeing this correctly...

Source
Now they (Clark et al) calculated the Relative Risk (RR) in a weird way (in my opinion):
Relative risks (RR) for NO2 concentrations experienced by nonwhites and whites calculated using: RR = exp(βc), where c is the NO2 concentration (units: ppb), and β = ln(1.066)/(4.1 ppb) = 0.0156 ppb-1.
They then show these calculations:


I think there is an error in this calculation. The second calculation is for the amount of IHD deaths anticipated for whites which should be divided by 1.167 and not 1.254. If I understand their thinking on this, they are comparing one population at an RR of 1.254 (nonwhites) to one at 1.167 (whites).

If I am correct, then the white IHD deaths would be 13,570 for a difference of 5,638 IHD deaths per year.

That amount, however, assumes that the entire US population of nonwhites is exposed to 14.5 ppb of NO2 while the entire population of whites is exposed to 9.9 ppb NO2.

To me, this calculation of 7,000, or 6,579, or 5,638 is not within the realm of reality. Could NO2 contribute to 5,000 plus IHD deaths per year? Yeah...that's possible if Jerrett's RR of 1,06 is a direct result of an increase in NO2.

That's not what Clark et al are wanting to convey:
Gap results in an estimated 7,000 deaths each year among people of color from heart disease alone
They assert that compared to whites, 7,000 more deaths from IHD happen because of NO2 concentrations for this group being 4.6 ppb higher than what whites are exposed to.

That high of a "gap result" is not supported by their data.

So what does the data they present actually tell us?


Next post: Part 4: Preventing 7,000 deaths from heart disease alone among nonwhites each year


Part 2: Preventing 7,000 deaths from heart disease alone among nonwhites each year

The amount of peer reviewed research papers that contain exaggerated claims of association and statistical - but meaningless - results that I come across is disheartening.

I don't want to be skeptical of every peer reviewed research paper I read, but I am.

The authors of this paper "National Patterns in Environmental Injustice and Inequality: Outdoor NO2 Air Pollution in the United States," are professors in the Civil engineering department at the University of Minnesota.

Their press release for their paper is titled:
Groundbreaking nationwide study finds that people of color live in neighborhoods with more air pollution than whites  Gap results in an estimated 7,000 deaths each year among people of color from heart disease alone
That claim of 7,000 deaths is front and center.

When I read the press release I was skeptical of that claim. I go where the numbers take me. I am just having a difficult time with their findings:
Assuming a 6.6% change in IHD mortality rate per 4.1 ppb NO2 [39] and US-average IHD annual mortality rates (109 deaths per 100,000 people [40]), reducing NO2 concentrations to levels experienced by whites (a 4.6 ppb [38%] reduction) for all nonwhites (87 million people) would be associated with a decrease of ∼7,000 IHD deaths per year.
I got hung up on the "87 million people." Where did that number come from? I don't mean where did they get it from, I mean why did they use it?

Once that brain nugget planted in my thinking as I read, I started trying to figure out what they were going after. I can only speculate as to their motives. What I write about are my questions and research into the validity of their claim.

The best place to start, me thinks, is with this table tucked away in their supporting data.


Looks like they used 2000 census data for the nonwhite population. What I cannot figure out is how they calculated the 14.5 ppb NO2 concentration for nonwhites. That number is critical in their claim of 7000 additional deaths from IHD.

According to their paper, that concentration is "population weighted."

If I understand this correctly, each "Block Group" or "BG" - defined as "the smallest Census geography with demographic data (race-ethnicity, household income, poverty status, education status, and age) reported in the 2000 Census" with a mean BG sizes of "1.1 km2 (urban), 185 km2 (rural),
and 45 km2 (mixed)" and a  mean (standard deviation) BG population of "1,350 (890) people."

The "population-weighted NO2 concentration" was calculated by summing up the concentration of NO2 in the BG multiplied by the population of the group. This sum was then divided by the sum of all of that group's population.

Okay...so I cannot offer an opinion on this method's validity or accuracy. I can, however, ask a couple of questions.

First, based on the data in the Excel spreadsheet they link to, this is what I calculated for the data identified as "urban":


Those averages are calculated from 448 urban areas within the US containing 119,643 BGs and a population of  160.8 million folks.

Call me skeptical, but if you are going to tell me the mean NO2 concentration for whites is 9.9 ppb - which is close to the mean concentration for 448 urban areas - then how do you support nonwhites in these 448 urban areas living in an average concentration of 14,5 ppb?

This means that within an urban area, whites live within the mean concentration of NO2 and nonwhites live in areas two standard deviations outside of this - as an average??

Call me intrigued.

What looks strange to me is this; if the population-weighted concentration is calculated and used, then wouldn't we see a very large difference in the concentration of NO2 for low-income nonwhites when compared to high-income whites?

If environmental justice is in play, pollution is more prevalent in low-income areas. High-income areas would be further away from highways and would have less NO2 spewing industries in their backyards.

If my logic is correct, low-income nonwhites would be exposed to more NO2 than high-income whites. Wouldn't we see a difference in the population-weighted NO2 concentration greater than 4.6 ppb (the difference between the population-weighted mean NO2 concentration for whites and nonwhites)?

Call me confused, but the data in their Excel sheet shows an average Low-Income Nonwhite (LIN) Population-weighted Concentration  of 11.1 ppb for 448 urban areas and an average High-Income White (HIW) Population-weighted Concentration of 9.8 ppb.

Call me perplexed, but that's a difference of 1.3 ppb for these two VERY different groups.

Are we sure about that number of 14.5 ppb NO2 represents the exposure concentration for nonwhites?

And are we sure that 87.000.000 people - the total nonwhite population in the US in the year 2000 - lives in this concentration of 14.5 ppb while all whites live in areas with 9.9 ppb?

Call me skeptical, but that's what I see is the problem with their conclusion. They claim:
Gap results in an estimated 7,000 deaths each year among people of color from heart disease alone.
That's based on an NO2 concentration of 14.5 ppb for 87,000,000 people - which is the total population of nonwhites in the US.


Next post: Part 3: Preventing 7,000 deaths from heart disease alone among nonwhites each year


Part 1: Preventing 7,000 deaths from heart disease alone among nonwhites each year

The press release from the University of Minnesota's web site reads:
A first-of-its-kind study by researchers at the University of Minnesota found that on average nationally, people of color are exposed to 38 percent higher levels of nitrogen dioxide (NO2) outdoor air pollution compared to white people.
The press release goes on to tell us:
...researchers estimate that if nonwhites breathed the lower NO2 levels experienced by whites, it would prevent 7,000 deaths from heart disease alone among nonwhites each year.
7,000 deaths - each year - prevented by breathing less NO2? That number seems....high...really high.

So I went and read their research paper.
An important issue is whether the NO2 disparities described above are relevant to public health. To investigate that question, we consider here one illustrative example: ischemic heart disease (IHD) annual deaths associated with NO2 concentration disparities between nonwhites and whites.
Here is what the author's write:
Assuming a 6.6% change in IHD mortality rate per 4.1 ppb NO2 [39] and US-average IHD annual mortality rates (109 deaths per 100,000 people [40]), reducing NO2 concentrations to levels experienced by whites (a 4.6 ppb [38%] reduction) for all nonwhites (87 million people) would be associated with a decrease of ,7,000 IHD deaths per year.
Since there are numbers quoted and cited, I went looking for [39] to see what those numbers mean.

The "6.6% change in IHD mortality rate per 4.1 ppb NO2" comes from this paper. Table 4 shows the "Relative risks ...for the interquartile range of exposure in each pollutant (i.e., 5.3037 mg/m3 for PM2.5, 4.1167 ppb NO2, and 24.1782 ppb for O3). Values in parentheses are 95% confidence intervals."

Based on the results in this table, exposure to 4.1 ppb NO2 showed a 6.6% increase [(1.066 - 1) * 100] in risk for IHD. Another way to look at this result is:
  • The risk of IHD in those exposed to 4.1 ppb of NO2 was 1.06 times as high as the risk of IHD compared to subjects who were exposed to less than 4.1 ppb NO2.
I am not going to question if, or if not, that number of 6.6% is valid. I am going to assume that it is.

Going back to the Clark et al paper, we are told that the annual death rate for IHD is "109 deaths per 100,000 people." Again...I am going to assume that this number is correct.

So we have these numbers. Assuming they are correct, how do they get us to preventing "7,000 deaths from heart disease alone among nonwhites each year?"
...reducing NO2 concentrations to levels experienced by whites (a 4.6 ppb [38%] reduction) for all nonwhites (87 million people) would be associated with a decrease of 7,000 IHD deaths per year.
Oh...I see what they did...
From WikipediaThe United States Census Bureau defines White people as those "having origins in any of the original peoples of Europe, the Middle East, or North Africa. It includes people who reported "White" or wrote in entries such as Irish, German, Italian, Lebanese, Near Easterner, Arab, or Polish." Whites constitute the majority of the U.S. population, with a total of about 245,532,000 or 77.7% of the population as of 2013.
So...with a total population of 323,730,000 in the US, 22.3% would be "nonwhites" for a total of 72 million. Since the authors don't cite where they got their "87 million people" from, I can only assume it was based on this type of thinking. [Note: I found it in the PDF attachment]

Let's use their number of 87 million (nonwhite) people.

If the incidence of IHD is 109 deaths per 100.000, then we would expect 94,830 of those 87 million to die from IHD each year.

If 4.1 ppb NO2 is associated with a 6.6% increase in risk and the risk of IHD is 109 per 100,000, we should see 109 x 1.066 = 116 per 100,000 or 7 more per 100,000 IHD deaths per year.

Based on my calculation, I get 6,258 more deaths. I think my estimate is correct based on this:
For example, say the absolute risk of a work injury is two per 100 workers. Due to an intervention, it drops to one injury per 100 workers. This yields a relative risk reduction of 50 per cent. Overall, in absolute terms, this means one less injured worker per 100.
All this number crunching is really not the issue here. What is bugging me is how the statement...:
 "it would prevent 7,000 deaths from heart disease alone among nonwhites each year."
...becomes the takeaway message from their research.

That number isn't even close to the reality at hand.

Next post: Part 2: Preventing 7,000 deaths from heart disease alone among nonwhites each year


Thursday, January 28, 2016

Flint Water: A Political Football. Part 14

Let's look at the Veolia report a bit closer.

In a previous post, I indicated that this date was important:
  • February 18, 2015  The City of Flint tests the drinking water at the Walters residence. Tests reveal high lead in the drinking water (104 ug/L)
  • February 18, 2015 Rob Nicholas, vice president for Veolia, states in a news conference that "(The problems) are less about the water itself and more about the (transmission pipes)." [source]
How unfortunate. Violia is there in Flint and was hired by Flint for their expertise:
Veolia appreciates the City’s decision to seek independent third parties to review current treatment processes, maintenance procedures and actions taken to date, and provide ideas for improvement. We are pleased to present this final report to the City of Flint following our experts’ 160-hour assessment of the water treatment plant, distribution system, customer service and communications programs, and capital plans and annual budget
One of those "ideas for improvement" was this:
Increase of Ferric Chloride – Four coagulants were tested by Veolia -ferric chloride, ferric sulfate, polyaluminum chloride (PACI) and aluminum chlorohydrate (ACH). Ferric chloride and ACH were found to be the best choice of product for effectiveness in removing TOC, a precursor to TTHM formation. 
I wrote about the addition of Ferric Chloride causing problems in this post.
March 2015: The City of Flint increases the Ferric Chloride dosage used in the filtration process to improve the removal of disinfection byproduct precursor material, in an effort to lower the TTHM levels.
...my research found this:
In practical case studies, coagulation with a chloride-based coagulant (e.g., ferric chloride) tended to increase lead leaching from simulated copper joints... 
...which is probably why on:
March 03, 2015: The City of Flint re-tests lead levels in drinking water at Walters’ residence. The lead level measured is 397 ug/L (ppb).
But that's not really the issue I want to point out. Remember why Veolia was hired, and remember what they said. They (Veolia) recommended using Ferric Chloride, which the city did. Veolia also provide warm fuzzy pats on the behind for everyone:
From our review, these numerous efforts demonstrate how the city is trying to be transparent and responsive beyond what many other communities might do in similar circumstances. 
Remember what was known about lead in two samples on Feb 18th and March 3rd. Remember who took those samples (the City of Flint).

Now read this from Veolia's report:
The City should be congratulated on its efforts to keep the public informed. It is posting its monthly reports on the web page to provide transparency, though these reports are highly technical – and may be too technical for the customer base at large
No one would have known about those lead results had it not been for the Del Toral EPA memo.

Those lead results were known by the city at the same time Veolia was there. In Veolia's own words we are told this:
It is our desire to help Flint residents and public officials better understand the current situation so that informed decisions can be made to ensure safe drinking water for the city’s customers.
Now go back and read their March 12th report. I'll wait.

Notice what's missing? Now go back and do a search for the word "lead." I'll wait.

Did you find what's missing?

Now go back to February 18th's news conference when Rob Nicholas, vice president for Veolia, says this:
"It's less about the water itself and more about the pipes," he said. "You're just getting debris flushed out of the pipes ... You don't want to drink it because it looks bad."
In my view, you cannot point the finger at one person and say; 'that's him! that's the culprit!'

This is a collective failure of those in the know and those with decision making responsibility.

It's not the using of Flint River water that was a bad decision, it was the failure to have in place what would be needed to treat that water. This was, in my opinion, ground zero for what I consider a failure that cannot be spun away with hindsight.

Once the spigot was opened it was doomed to fail because they had not put in place what was needed to properly treat the water. I have shown that in these last posts so my SPECULATION is supported.

Once it was found to be failing, the spin train started and the failures started piling up:
  1. Veolia failed the City of Flint by not addressing the lead that was detected in the Willams' home.
  2. Veolia failed the City of Flint by not addressing corrosion control as it relates to the issue of lead. The only recommendation for corrosion control was that "the water system could add a polyphosphate to the water as a way to minimize the amount of discolored water."
  3. The City of Flint failed by not reporting the two lead results from the Williams home. This did not keep the "public informed" and this did not "provide transparency." 
  4. The EPA failed when it failed to address the lead found at the Williams' home and addressed by the EPA's Del Toral, telling those wanting an answer on safety that “it would be premature to draw any conclusions” 
  5. The MDEQ failed by issuing all sorts of statements telling the public everything was okay and those that said there was a problem were out for some agenda. For example: "The connection between water and blood is there's other sources of lead getting into kids' blood. Historically lead has represented approximately less than 20 percent on the average of lead found in kids' blood as the source...it's not the big source historically.
  6. The Mayor of Flint failed when he drank the water to prove it was safe.
  7. The MDHHS failed when it did not look at the blood-lead levels in children by zip code and then criticized the work of a doctor who did trying to discredit her.
I'm sure you can come up with a whole bunch more. So I guess to put an end to these 14 posts I need to kind of end with a summary.

Here is the lesson I take away from all of this.

When there is a change from the norm, you need to be observant to ensure that the change has not created any problems.  Just like organic kitty-litter is kitty-litter, it is fundamentally different from clay kitty-litter.

Same goes for water. In the case of Flint all eyes should have focused on lead leaching out once the corosivity of the Flint River water was known to be an issue due to the age and condition of the water system and the homes it fed. At that point, the MDHHS should have been looking closely at blood-lead levels in children under 5 years of age and the MDEQ should have been out there testing for lead.

Lead was a real hazard to the public if it was leaching out due to the corosivity of the water.

So the takeaway from all of this is that when treating water to be used for drinking, its all about the water chemistry.

Flint is a casebook study of what not to do with drinking water.  But in case you have forgotten:


Thanks for reading!

Jeff

Flint Water: A Political Football. Part 13

Lucky number post 13!

If we take out hindsight, what are we left with?  Incompetence? Willful disregard? Apathy?

Those words really don't fit well here, although they do - pardon the pun - contaminate what went on.

As I see it, and this is after a week of looking at all the stuff I could find (so take that into consideration regarding how much stock to put into my opinion), what took place in Flint was a snowball that got bigger and bigger as it rolled down the hill.

So if we look at it like a snowball, the question to ask is who - or what - started it down that hill?

I SPECULATE that it was the result of a decision to use Flint River water with the knowledge that it would be difficult to treat but with the assurance that it could be treated.

The problem is, as I pointed out in my last post, is that thinking was folly.

The City of Flint, as was documented in Veolia's March 12, 2015 report clearly identifies the lack of treatment capability and knowledge on the part of the city. They did not have the monitoring equipment to confirm the water chemistry was correct and they did not have the trained operators that understood how to treat this particular water.

They knew, before they made the switch to the Flint River, that the water would be a challenge. They knew this but did it anyway. They were told it was a bad idea, but went forward anyway. Why?

SPECULATION It was money that made them ignore the negatives. If you look at the projections of cost savings to use the Flint River in place of continuing to use Detroit water during this gap in time, you can see how it most likely became 'damn the torpedoes! Full steam ahead!' by those in charge.

Was it the Governor who made this call? Does it matter? If one person can overrule all the others who have responsibility; the health department; the environmental department; the engineering firms; the water operators; the mayor, the city council, the people...then we have a serious problem with how we govern.

If it wasn't the Governor and it was that unelected emergency manager assigned by the Governor, we still have the same issue. Someone overruled the technical people telling them what it would take and that it was a bad idea.

...or all those technical people were incompetent, or on the take, or wanted to promote genocide, or wanted the Republicans/Democrats to look bad.

You see where this goes?

SPECULATION It was the cost savings that put the Flint River as the gap water source in play, and everyone who opposed it got on-board because of who was on-board. Groupthink took over because of the players at the table.  Each one said their concern, and then gave their approval with the understanding that those concerns would be taken care of.

If everything went as they planed it, it would work.  Its water afterall, we treat water all the time from many different sources and make it into drinking water. We knew it would be hard going in, but golly we can do it!
On June 29th 2013, following many preliminary discussions on how the City would fill the interim gap, a formal, all day meeting was held at the Flint Water Plant with all interested parties including City of Flint Officials (COF), representatives from the Genesee County Drain Commissioners Office (GCDC), the Michigan Department of Environmental Quality (DEQ), and the design engineers from the previous plant upgrade Lockwood, Andrews, and Newnam (LAN).
Everyone was there. See! Look at what we discussed!

Source
It all sounds good when in an air conditioned room. This ship done sailed and it was going to be up to the Flint Water System employees to make it work. Go for it guys!


SPECULATION Somebody done messed up! Who? All of them.  Groupthink took over because the guy in charge said we are going to use Flint River water, make it work. And they did...on paper.
These facts were balanced against a licensed staff, LAN engineering’s extensive experience in this field, advanced equipment that Flint has for treatment, and support from the DEQ.
Snap back to reality. Oh, there goes gravity...
...the same diligence was given in determining what source water to use while waiting for the community supported KWA water to arrive. The City concluded from this work that the Flint River presented a safe and financially responsible alternative water source.
Yes, but you did not finish it.  You opened up that spigot and you did not put in place the operators, monitoring, and sampling protocol needed to do what you wanted to do. You claim you had it all figured out, but reality says differently.

It was a safe alternative only if you made it a safe alternative. That did not happen.  That's not a hindsight problem, that's a failure to follow through problem. Who's fault is it then when the response is:
The decision to use the Flint River as an intermediate water source was approved by state regulatory officials in 2014...
LAN engineering’s extensive experience in this field...
The DEQ requires...an F-I state licensed operator in charge that oversees the operation of the treatment process. This license is the highest classification in the state that specializes in “complete treatment” The City of Flint has such a person on staff at the water plant and that person’s responsibility is to determine the correct levels of chemical treatment, monitor the system, submit official test results to the state regulatory agency, and make necessary adjustments when contaminant levels are breached. All of these steps were followed and acknowledged by the DEQ.
See, everything is in order.  That's January 13th, 2015.  Now look at what Veolia tells us in their report dated March 12th, 2015:
The February 2015 report from LAN...indicated apparent reasons for the elevated levels of TTHM in the distribution system. Obtain a THM Analyzer and Carry Out Jar Testing.
That should have been in place on day one.  In March, 2015 Veolia recommends:
The staff understands the basic treatment process but needs further practice and training to become proficient in the use of routine process control to adjust for water quality.
The amount of testing and resulting changes in chemical dosages, along with monitoring the impact on the water, will require a well-documented process that all operators follow. An example of this is jar testing, which is used by the operators to identify the most effective chemicals and dosages to optimize treatment.
Standard operating procedure needs to be set and lab technicians trained in that process.
 ...should also consider a TOC analyzer that can be an online continuous device to provide immediate information on influent and effluent levels of TOC. 
Do I need to say it again? This should have been in place when the Flint River spigot was turned on.

Reading the Veolia report does bring up some interesting questions as to how much was said and how little was done.

Next post: Flint Water: A Political Football.  Part 14

Wednesday, January 27, 2016

Flint Water: A Political Football. Part 12

Speculation: The Flint Water System was not set up to treat drinking water, especially the type of water, with its wacky water chemistry. They lacked the knowledge, the chemistry, and treatment prowess necessary to get this done in 10 months when the Flint River spigot was turned on.

Can that be supported?

Let's look at this.
  • April 25, 2014: Pipes carrying Flint River water are opened; the Detroit supply is shut off.
  • February 18, 2015  The City of Flint tests the drinking water at the Walters residence. Tests reveal high lead in the drinking water (104 ug/L)
That Feb 18th date is critical on what was known by whom and when.  Look what also happened on February 18th:
"The city has reduced levels of TTHM, and now all (testing) sites are in compliance," said Rob Nicholas, vice president for Veolia, the consultant that city officials introduced during a news conference just last week. "(The problems) are less about the water itself and more about the (transmission pipes)." [source]
Who or what is Veolia?
Veolia is the world's largest water services and technology company. Its team started work in Flint last week and is being paid $40,000 to assess how city water is tested and distributed, including water treatment processes and operations, laboratory testing and analysis. [source]
"Last week" would have been around February 11th. The Flint River water has been flowing into the Flint Water pipes now for around nine months.  The City of Flint now brings in Veolia to report on whats going on. Here is what we are told on March 12, 2015:
The City of Flint has made a number of good decisions regarding treatment changes that have improved water quality. However, this is a very complex water quality issue and the City is seeking additional advice on what to do to ensure healthful drinking water for the community.
Let's look at this change described in Del Toral's EPA memo:
  • March 2015: The City of Flint increases the Ferric Chloride dosage used in the filtration process to improve the removal of disinfection byproduct precursor material, in an effort to lower the TTHM levels.
  • March 03, 2015: The City of Flint re-tests lead levels in drinking water at Walters’ residence. The lead level measured is 397 ug/L
You do see the dates, and you do see the findings, correct?
The review of the water quality records during the time of Veolia’s study shows the water to be in compliance with State and Federal regulations, and, based on those standards, the water is considered to meet drinking water requirements. [source]
Consultant speak for 'WE never said it was safe...'

But I digress. Can I support my speculation that the City of Flint, a purchaser of treated water for many years, was in no way, shape, or form to treat water being pulled from the Flint River. All of these issues can be blamed on the decision to use Flint River water without an adequate understanding of not just how to treat it, but having the ability, know-how, and understanding of how to treat that water.

Let me show you exhibit one from the Veolia report:
The amount of testing and resulting changes in chemical dosages, along with monitoring the impact on the water, will require a well-documented process that all operators follow. An example of this is jar testing, which is used by the operators to identify the most effective chemicals and dosages to optimize treatment.
No jar testing kind of means ya aint ready for water treatment.  Its kind of like not having a pipe wrench when you call yourself a plumber.
The staff understands the basic treatment process but needs further practice and training to become proficient in the use of routine process control to adjust for water quality.
Flint River water was way beyond 'basic' treatment.
...that a desired water treatment quality is defined and variations from it signal alarms and that the staff knows what to do when the water quality setpoints begin to drift away from its desired quality levels. 
Figuring this out 10 months into the use of the water is...well...a sign that you ignored the folks telling you not to go this route.  Flint was not ready to treat Flint River water. I think if you ask enough people that were present during this discussion, you will find this was known at the time but ignored by a higher up. Once that happened everyone falls in line, gives their tacit approval while holding up their proof that they tried to let them know.

But the engineers agreed to it! Yeah...just like they did with the Challenger disaster.

Okay...so file this one under my pipe wrench analogy as well:
The City has already purchased a TTHM analyzer but should also consider a TOC analyzer that can be an online continuous device to provide immediate information on influent and effluent levels of TOC. 
Really...and you call yourself a drinking water producer?

And now, exhibit two!
A good demonstration of skill level is for the staff to become certified by the State as a licensed water plant operator. Many utilities now require all operators to hold at least the minimum certification level as a starting point and offer incentives to increase their certification level.
So...they had no certified staff responsible for treating this water?  They did not understand this skill level when they decided to treat the Flint River water?

How we got to today is a decision to treat Flint River water without the capability and knowledge required to treat it.

SPECULATION: Someone brought this up to the folks in charge at the appropriate time. I guarantee it! Someone told them it was going to be a problem and what those problems would be. Someone - or a bunch of them - understood the water chemistry issues.

Next post: Flint Water: A Political Football.  Part 13


Flint Water: A Political Football. Part 11

So what's it all about Alfie?

Ready for some speculating? Because that's where this here post is going to go.

How did this happen, not how as in they used Flint River water, duh! Or its because they were run by Democrats, or because of genocide.  All of those are put out there as theories, but they really can't explain the "how."

Let's start with this document:

...in particular Question 5's answer.  The question is not important, nor is the contaminant.  What is notable is this part of the response:
What we discovered is that as water travels through the 600 miles of the City’s distribution mains it will, at times, reside in the system for up to 3 or 4 weeks. Water purchased from [Detroit Water and Sewerage Department] DWSD is drawn from Lake Huron, chlorinated, and then travels over 80 miles to reach the City. By the time the water reaches Flint it is stable and capable of withstanding this type of residency time within the system. Water drawn from the Flint River, specifically in summer months when the temperature is fluctuating, is more susceptible to being impacted by variables such as high residency times and increased chemical reaction.
It's all about water chemistry and they were unprepared to handle it. Now let's go back to the decision to use the Flint River as their water source.
On March 25th 2013, after evaluating cost comparisons for a permanent water source approv[ed] a resolution to purchase water from the Karegnondi Water Authority (KWA).
This is important to understand,  Before the Flint River was used as the water source, the city of Flint purchased water from the DWSD.  The resolution passed was to start purchasing the water from KWA.

The word to focus on is purchase.
On April 17th, 2013 DWSD sent a letter terminating the existing water service contract between the City of Flint and Detroit.  With the termination set to take effect 12 months later on April 17th 2014, a gap was created between the end of the DWSD contract and the start of the KWA.
This "gap" is where the problem began.  Their answer, to use the Flint River, was the wrong decision to make.  Not wrong in hindsight, but wrong because of that word "purchase" used previously.
On June 29th 2013, following many preliminary discussions on how the City would fill the interim gap, a formal, all day meeting was held at the Flint Water Plant with all interested parties including City of Flint Officials (COF), representatives from the Genesee County Drain Commissioners Office (GCDC), the Michigan Department of Environmental Quality (DEQ), and the design engineers from the previous plant upgrade Lockwood, Andrews, and Newnam (LAN).
We learn this from a deposition on an unrelated issue:
Ambrose [Flint's financial manager] testified under oath in 2014 that Kurtz [Flint Emergency Manager at the time] considered using water from the Flint River for the city’s drinking water, but rejected it after consulting the Michigan Department of Environmental Quality. The plan was found “not to be feasible,”
That took place in December of 2012.  Here is where it gets good...
“Who determined it wasn’t feasible?” the attorney asked. 
“It was a collective decision of the emergency management team based on conversations with the MDEQ that indicated they would not be supportive of the use of the Flint River on a long-term basis as a primary source of water,” replied Ambrose.
“What was the reason they gave?” asked the attorney
“You’ll have to ask them,” Ambrose replied.
On June 29th 2013 to April 25th, Flint needed to switch from a purchaser of water to a treater of drinking water. That's 10 months to build the capacity - both in capability and structure -to treat drinking water.

Why is this problematic?  Let's look at this May 2013 report from their neighbor, the City of Cleo, who is also a purchaser of drinking water.

Water systems who purchase drinking water don't treat water.  They pass it on, make sure they monitor it, and, for the most part, set it and forget it.  The job to treat and make sure it is safe is the producer of the drinking water, which was Detroit for many years..

Speculation: The Flint Water System was not set up to treat drinking water, especially the type of water, with its wacky water chemistry. They lacked the knowledge, the chemistry, and treatment prowess necessary to get this done in 10 months when the Flint River spigot was turned on.

They were aware of the need to do so, it appears:
It was understood that the Flint River would be subject to temperature variations, rain events, and have higher organic carbon than Lake Huron water and would be more difficult to treat. These facts were balanced against a licensed staff, LAN engineering’s extensive experience in this field, advanced equipment that Flint has for treatment, and support from the DEQ.
 In hindsight that was underestimated and in my opinion folly to think they could.


Next post: Flint Water: A Political Football.  Part 12

Tuesday, January 26, 2016

Flint Water: A Political Football. Part 10

I looked at Marc Edwards' numbers and did some calculatin'

Source

Here is what the Virginia Tech Research Team tell us:
Over the weekend, we analyzed all samples shipped to Virginia Tech from Flint to date. Flint residents have already returned an astonishing 84% of the sample kits we sent out (252 out of 300 samples). 
The protocol they used can be found here:
Students and scientists (see About Us) at Virginia Tech assembled and shipped 300 kits for Flint residents to sample their water and get it analyzed for lead. The kits comprise of three bottles (1L, 500 mL and 250 mL ones) and an instruction sheet for sampling tap water. All 300 kits were sent out August 14th (Friday) and reached Flint on August 19th (Wednesday). 
The Excel file I downloaded,  Flint-Samples-FINAL.xlsx, contains 300 sample points (I am kind of confused as to why this number does not match with the statement above) from which three samples were collected at each point:
  • Pb Bottle 1 (ppb) - First Draw
  • Pb Bottle 2 (ppb) - 45 secs flushing
  • Pb Bottle 3 (ppb) - 2 mins flushing
The average lead concentration reported on the sheet for the first draw is 10.646 ppb.  I took all these sample results and recalculated using Excel's statistical function and I got the same number.

I then looked to see what the largest number reported was for each of the three sample columns. With this many sample points you can see a trend.  Since these samples were collected by the homeowners, the possibility of human error in sampling bottle identification is high.

That being the case, I felt that three samples were incorrectly identified, so I removed them from the rest of the data points.  This left 297 sample points from which to run some calculations.

What I wanted to see was if there was a difference between the first draw and a flush.  The problem with this data as presented was that sample 97 reported results in this order:
  1. 7.244
  2. 1051
  3. 1.328
It is possible that 1051 ppb is a legit number, but it appears doubtful that the 45 second flush would produce such a high number when the first draw was only 7.2. Additionally, this one numbers skews the results for the 45 second draw too much to make a comparison between first draw and flushes appropriate.

Removing samples from the data is a judgement call, and I think I can justify removing them in an effort to get a truer picture of what is going on.  I also removed samples 258 and 24 because I think they are in the wrong order - their removal changes the average but still shows a drop in lead when a flush was used.

So here are my results.  For 297 sample points:


As you can see, there is a reduction in the amount of lead found in the 45 second sample and even less in the 2 minute flush sample.  This supports the contention that the flushing requirement Flint was having the homeowners perform to meet the Lead and Copper Rule was most likely under reporting the lead.

What's important here is to not get caught up in the averages. This data came from a mix of homes in Flint.
Flint’s non-profit group Water You Fighting For? is helping coordinate distribution of these kits to volunteering homes 
There are, as the Williams' sample results showed - when compared to their neighbors -, houses within Flint that are more impacted then others.  

There is overwhelming evidence that there is lead present in Flint's water and it is higher in lead than water produced by Detroit.
Response:  We coordinated a citizen sampling event of homes in Detroit during 2010, and confirmed that Detroit water met Federal Standards—Flint’s water does not. 
What is more telling as to the extent of the problem is the spike in elevated blood-lead levels that I wrote about in my last post.  Exposure is problematic, uptake is worst when you know it has happened, but proof of an elevated level found children under five...well that's pretty damning evidence that you have a problem.

So what can we take away from all of this?


Next post: Flint Water: A Political Football.  Part 11

Monday, January 25, 2016

Flint Water: A Political Football. Part 9

How about some data from a non-governmental source?
Sept. 24-25, 2015: A group of doctors led by Dr. Mona Hanna-Attisha of Hurley Medical Center in Flint urges the city to stop using the Flint River for water after finding high levels of lead in the blood of children. State regulators insist the water is safe.
Here is how this played out:
In August, Hanna-Attisha looked back at the lead tests of 1,750 children taken at a local hospital. She and colleagues released the results at a news conference in September.
Her findings:
“We found that when we compared lead levels before and after the [water] switch, the percentage of kids with lead poisoning doubled after the switch,” she said last week. “In some neighborhoods, it tripled. And it all correlated with where water lead levels were the highest.”
And the state's response to her work:
State officials questioned the findings and accused Hanna-Attisha of causing unnecessary hysteria. The state has since agreed that her data were accurate.
Let's look at her work and judge it for what it shows.

What's interesting here is that she asked a question that should have been obvious to the MDHHS.  Was there a difference between children's blood-lead levels (BLL) before the water change and after.  And more specifically, in zip codes where the leaching of lead would most likely take place.

You can look at her presentation here.  I am going to showjust her methodology and findings below.

First, her methodology:


She looked at the same period of time, pre-switch and post-switch. Was there a statistical difference between the period pre-switch and the same period post-switch?


Her analysis of the BLL data pre and post-switch shows affirmative. Before the switch 2.1% of the children in those zip codes in Flint had elevated BLL.  After the switch it was 4%.  That's a pretty good indication that the water is the culprit.

But wait a minute.  Maybe its not the water and something else going on! Okay, fair question. How about we look at the children in that immediate area, but not in the zip codes where they used Flint water.  If we see an increase in their elevated BLL then we can rule the water out as a soul source contributer. Does that sound reasonable?


No statistical change.  What happens if we look at the BLL of children where Marc Edwards found elevated levels of lead above 15 ppb in the tap water samples they took? We'll call that data "High-water lead."


Putting it all together we get this:


Just in case you have had enough of the "golly we goofed" quotes, let's look at this talking point prepared in November 18, 2015 by the MDHHS:


And y'all never saw a reason for this level of testing while all this was going on?

But you did see a reason to question Hanna-Attisha's data on September 25th, correct? From an email for Gerlyn Lasher with MDHHS to the Governor's chief of staff Dennis Muchmore:


Notice how he put the quotes around the word data?

On October 2nd we get this statement from MDHHS Director Nick Lyon in the Governor's press release:
State health experts said there has been an increase in elevated childhood blood lead levels in some specific communities. Initial analysis of MDHHS data found that blood lead levels of children in Flint have followed an expected seasonal trend. While this analysis for Flint as a whole remains true, a comprehensive and detailed review brealking down data by ZIP codes with the city revealed that MDHHS data is consistent with a study presented recently by Hurley Children's Hospital.
Look everyone, we found the same thing! Dr. Lyon continues:
"While we cannot conclusively say that the water source change is the sole cause of the increase, this analysis supports our efforts as we take active steps to reduce all potential lead exposures in Flint," 
Dude, give it up...its the water.

Let's take a look at Marc Edwards' data next.


Next post: Flint Water: A Political Football.  Part 10

Flint Water: A Political Football. Part 8

September 24-25th:
A group of doctors led by Dr. Mona Hanna-Attisha of Hurley Medical Center in Flint urges the city to stop using the Flint River for water after finding high levels of lead in the blood of children. State regulators insist the water is safe. [source]
On September 25th we get the "political football" email:
The DEQ (Department of Environmental Quality) and DCH (Department of Community Health) feel that some in Flint are taking the very sensitive issue of children's exposure to lead and trying to turn it into a political football claiming the departments are underestimating the impacts on the populations and particularly trying to shift responsibility to the state," said Muchmore. [source]
All of this data coming in and the MDEQ and the MDCH - the agencies with public health responsibility - tell the Governor's man that it ain't their fault.

The wheels have come off and they all know it.

These dates on the timeline are when it can reasonably be assumed that it is known.  It would be very odd that before that date parties that have something to do with this issue had no idea what was being looked at.

So let's look at blood-lead levels.

Before I knew about the work of Dr. Hanna-Attisha, I saw this table in the Detroit Free Press:
Detroit Free Press
When I saw this I thought, 'well there is not a difference between 2014-2015 when the water was from the Flint River and 2012-2013 when the water was from Detroit!'

That's what I saw. That's what I see. And I was told this by the MDHHS:
Michigan Department of Health and Human Services spokeswoman Angela Minicuci told the Free Press on Thursday that the increase was "seasonal and not related to the water supply."
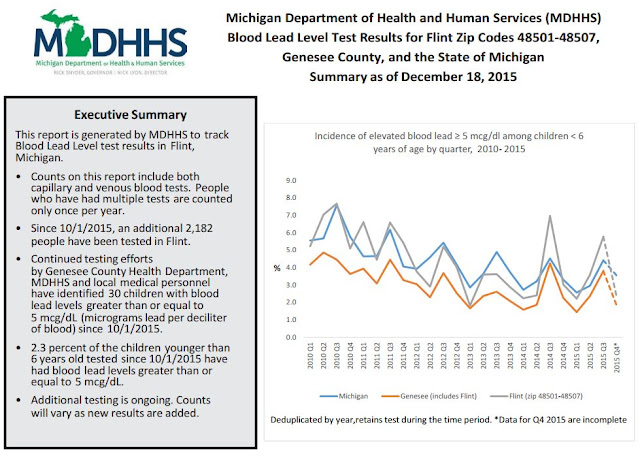
Look at the graph MDHHS provided in September:

September 2015
This graph looks at the number of children with elevated blood-lead levels (EBL) per quarter.  .

I have looked at the data the MDHHS provides and I cannot make anything out as bad.  Maybe I am missing it, but what they provided does not indicate a problem.  And that, could be why they did not see it. The data is in there, but it is covered up and not obvious.
"This is definitely being driven by a little science and a lot of politics," Wes Priem, an Industrial Hygiene Manager with the Healthy Homes Section of the Michigan Department of Health and Human Services, said in September 2015.
That's an interesting quote and tells you where there conventional wisdom was coming from.
In preparation for a late-September 2015 press conference and in response to data released by Edwards, Michigan Department of Health and Human Services Director Nick Lyon emailed fellow staff, "I would like to make a strong statement with a demonstration of proof that the lead blood levels seen are not out of the ordinary and are attributable to seasonal fluctuations."
On Thursday night, I shared this thinking as well.  But then I got some data...
"It wasn't until later that MDHHS epidemiologists took a more in-depth look at the data by ZIP code and confirmed an increase outside of normal trends,"
December 2015

The graph presented in December it looks at the incidence of EBL per quarter and looks at it based on zip codes.  This removes the noise generated from all the other data points so you can see there is a significant spike.  To be honest, these graphs are all over the place, but they do show similar peaks and valleys.

Still...
January 23, 2016: The Michigan Department of Health and Human Services' own review last July showed a spike in blood-lead levels in Flint children in the months after the city switched its water supply to Flint River water. "If I knew then what I know now ... We needed a much more robust analysis," Dr. Eden Wells, Health and Human Services' chief medical executive, said Friday.
Which brings me back to looking at this in contexts, as a whole. New water source, complaints, EPA Del Toral memo, lead found at the Walters home, Walters' kids with an increase in blood-lead levels.  What more do you need to see to conclude that a closer look is necessary?  that's not hindsight in my opinion.
"We should have torn it up and apart and gone up and down with that (data). That wasn’t done. "When I think about how Flint citizens have just had one thing after another — not just over the past two years, but many, many years — I wish that was not a missed opportunity." [source]
There seems to be a lot of "golly, if I had only known!" coming from Michigan's governmental agencies responsible for protecting public health.

Enter Dr. Mona Hanna-Attisha of Hurley Medical Center in Flint.

 Next post: Flint Water: A Political Football.  Part 9

Flint Water: A Political Football. Part 7

On our timeline we are a "T = September 21, 2015" and the MDEQ and the city of Flint are still acting as if there isn't a problem.

On September 9th, Marc Edwards with Virginia Tech writes an email to the mayor of Flint, Dayne Walling:
I understand how you could have been misled. All I can tell you, is that from a scientific and engineering perspective, everything in Mr. Del Toral’s memo was 100% accurate. I verified many of the facts personally myself.  The rest is perfectly obvious to someone with any reasonable training and experience in the field.
I too could not find anything wrong with EPA's Del Toral's memo.
I am sorry that MDEQ did not take his memo seriously, and that they did not cause the City of Flint to consider corrosion control from the start of this process. It was their job to do so. I have no idea what MDEQ’s agenda is, but based on their press releases and actions to date, protecting the public and following Federal laws, does not seem to be a priority.
Remember that "primacy" thing I wrote about? That's my contention as well.

The mayor then sends an email that very same day to Susan Hedman with the EPA about Marc Edwards' recent findings:


September 10th we get this bit of news:
The EPA said that while city water is within allowable levels for lead, it has "recommended that Flint implement corrosion control treatment as soon as possible since the city's lead service lines can leach lead into the drinking water if left untreated."
  From that same news article we learn this:
Virginia Tech students and faculty have posted the results of 252 water tests from Flint online, concluding the city has "a very serious lead in water problem."
The Virginia Tech testing so far has shown 10 percent of the water samples from across the city tested at 25 parts per billion of lead or more -- far more than the allowable level -- 15 ppb -- set in federal guidelines.
Overall, the Virginia Tech testing showed 16.7 percent of Flint samples showed more than 15 ppb of lead.
And...
Meanwhile, the city's official test results show 90 percent or more of the samples are 15 ppb or less, according to the state, and the water is meeting all standards for safety.
Okay, so data wise, by September 10th we know this for pretty gosh-darn certain:
  • 104 ug/L that jumped to 397 ug/L after ferric chloride was added.
  • Home #2 (4614 Bryant Street) indicate that the portion of the service line from the external shut-off valve to the water main is likely made of lead, which is consistent with the historical practice in Flint. The sampling had a high lead result (peak value) of 22 ug/L.
  • Water at 216 Browning Avenue (using a firstdraw, pre-flushed sampling protocol) yielded a high lead result (22 ug/L). 
  • Water at 631 Alvord Avenue, yielded a high lead result (42 ug/L).
  • Removal of the old service line to the Walters' home showed all kitchen tap and bathroom tap results for lead and copper were low, confirming that the sources of lead were external to the home.
  • 10% of 252 water samples tested at 25 parts per billion of lead or more.
  • 16.7 percent of Flint samples have been shown to have more than 15 ppb of lead.
So what does MDEQ's Communications Director Brad Wurfel have to say about that?
Flint residents "who have lead pipes or a lead service connection had lead in their water at some level before this issue was in the newspaper ...  before the switch to the Flint River, Optimizing (corrosion control) can minimize impacts, but it won't alleviate the issue."
Now you can kind of see why the guy was asked to resign. Just in case you may be confused here, the LCR requires corrosion control.  Corrosion control was what they were required to do and what they should have done when they were told by Del Toral of the issue. The goal of corrosion control is to get the lead that leaches from these old pipes to as low as possible.

Had they done that, in the very early days, all these folks would still have a job and I would not be writing these long-winded posts.

You can file this next email under "you are only as good as the people you listen to."


It's around September 30th that the wheels really start to come off their spin machine. Let me remind you, at this point we have not talked about that other data out there regarding the blood-lead levels.

October 7th, 2015:
"Actions that the state of Michigan and the city of Flint announced last week are important steps to protect public health," said Susan Hedman, the EPA's administrator for the region. "The immediate steps being taken to implement corrosion control will reduce lead in drinking water, as required by the Safe Drinking Water Act. U.S. EPA will continue to provide technical assistance to the state of Michigan and the city of Flint to support their joint effort." [source]
Would you look at that! Just what the Del Toral's EPA memo back in June recommended.  Imagine that!

Right before this, around September 24-25th:
A group of doctors led by Dr. Mona Hanna-Attisha of Hurley Medical Center in Flint urges the city to stop using the Flint River for water after finding high levels of lead in the blood of children. State regulators insist the water is safe. [source]
I wonder what data we can get from that?

Next post: Flint Water: A Political Football.  Part 8

Flint Water: A Political Football. Part 6

We kinda know now that what was going on in Flint from April of 2014 to July 2 of 2015 was being downplayed by the EPA, MDEQ, and Flint.

There are a number of reasons for this, some of them valid, other not so much.  I can speculate as to why I think this happened, and I probably will at the end if I can make a good argument.

Right now I want to be able to show a reasonable person that what was known at the time should have lead to a different approach.  Forget hindsight in this case. Was there data known that should have moved the response in a different direction?

The "political football" comment the Governor's chief of staff made on July 22, 2015 is based on the prevailing attitude at that time.  Don't blame him for that conclusion.  That's the input he has been getting from all the players who have a responsibility to protect the public.

On July 2, the head of the Midwest region of the EPA, Susan Hedman, tells the Flint mayor that “it would be premature to draw any conclusions” based on Del Toral's draft EPA memo that is now out in the public.  That comment, in context, was directed at the ACLU who is asking questions.

Still...the data...

If you were the mayor of Flint, and all this was going on, and you aren't a public health official, you aren't a toxicologist, you aren't a water operator, and the Head of the EPA's region tells you “it would be premature to draw any conclusions” - and nothing else of substance - what would you conclude about your water "crisis" going on?

All of this downplaying, or at best "bad choice of words," leads to this statement on September 25th from the Governor's chief of staff:
The DEQ (Department of Environmental Quality) and DCH (Department of Community Health) feel that some in Flint are taking the very sensitive issue of children's exposure to lead and trying to turn it into a political football claiming the departments are underestimating the impacts on the populations and particularly trying to shift responsibility to the state,
 July 2nd to September 25th, we have the Governor's office, the MDEQ, and the EPA doing what?

July 9th the ACLU press release is issued.  Del Toral is quoted - as a private citizen - telling the ACLU:
I don’t want to scare people unnecessarily, but there is absolutely a problem in Flint that needs to be addressed right away.
We also learn from the ACLU this:
According to Del Toral, Flint should be adding corrosion-control chemicals designed to help keep lead and copper in pipes from leaching into drinking water. Doing so is required by federal regulations, wrote Del Toral in his memo.
We have discussed this EPA memo in detail already.  What we find out from the ACLU is how Flint sees this:
"To our knowledge, that is inaccurate,” said Flint spokesman Lorenz. “Before the plant was placed in operation, the City (and our engineering firm) had numerous discussions with DEQ personnel and inquired if corrosion-control chemicals – typically phosphates --needed to be included in the treatment process. The use of these chemicals was not required or mandated.”
This statement perplexes the heck out of me.  It shows a complete lack of understanding of the city's responsibility under the Lead and Copper Rule (LCR). When the plant was built has nothing to do with corrosion control responsibilities.  That's why under the LCR you sample every year.

Now let's look at this letter from the MDEQ to Flint dated August 17, 2015:


As you can see, the Flint Spokesman, Lorenz, has been,,,err,,,misinformed. Who is advising these folks in Flint?

Let's also look at the ACLU's concern that has now been pointed out.
The Walters family surely isn’t alone in dealing with the threat of lead-laced drinking water. About half of Flint’s 40,000 homes are a half-century old or older, built at a time when water service lines were typically made of lead.
That's the concern I went with as well when I looked at the data presented in the Del Total memo.

Regardless of the LCR requirements on when to report, there is now evidence of lead leaching into the water caused by the City's failure to treat. If triple digit lead results were seen in a house without lead plumbing, what is happening to homes with lead plumbing?

To me, that's a reasonable and prudent approach to take if your concern is protecting public health.

Look, I am trying to remain as neutral and objective as I can, but I am finding it increasingly hard to not conclude gross incompetence as the mitigating factor for the City of Flint and the MDEQ.

Back to the timeline.  May 9th the ACLU story breaks. How does the city respond?
Flint's mayor drinks water from tap to prove it's safe 
July 10, Susan Hedman sends out a benign press release:


Not much in terms of emails takes place until August 23 when Marc Edwards with Virginia Tech informs all the parties of their Flint Water Study group that they have formed.

About one month later in September, MDEQ spokesperson Brad Wurfel writes:


Mr. Wurfel also resigns after a task force cited department failures in addressing the Flint water crisis.
In a letter to Gov. Rick Snyder, the Flint Water Advisory Task Force pegged the "substance and tone" of the department's communications as one of three failures, along with failing to correctly interpret lead and copper rule and a regulatory failure.
On September 21st the MDEQ is responding as if the lead in the water is just as normal as it has always been.  Mr. Wurfel also states that the water "presently meets all state and federal water quality standards."  That's false as Del Toral's EPA memo states.
"Throughout 2015, as the public raised concerns and as independent studies and testing were conducted and brought to the attention of MDEQ, the agency's response was often one of aggressive dismissal, belittlement, and attempts to discredit these efforts and the individuals involved," noted the task force's letter. "We find both the tone and substance of many MDEQ public statements to be completely unacceptable."
After his resignation Mr. Wurfel is quoted stating:
There's no denying it, the Department of Communications could have been better...the department was doing its best with highly technical information that frequently changed. When the department realized it looked like it had made a mistake, it admitted that.
My sympathies are guarded here.  On September 21st, the MDEQ was still not catching on.

Remember this from the Del Toral EPA memo?


But as they say on infomercials selling us all kinds of stuff, "but wait there's more!"


Next post: Flint Water: A Political Football.  Part 7