Showing posts with label UTA. Show all posts

Thursday, February 17, 2011

Air Quality in the Barnett Shale - Part 16: Dr. Sattler's Deposition - Those Seven Chemicals

In the Wolf Eagle Environmental report for the Town of Dish, Texas, Alisa Rich used values produced from dispersion modeling performed by Dr. Sattler of UTA.  These values are listed in Table 2:


Dr. Sattler's dispersion modeling maximum concentrations were developed using sampling data - collected with six SUMMA canisters possitioned a distance away from the oil & gas production site - provided by Alisa Rich.  Of these seven chemicals, two (Benzene and Toulene) are part of BTEX which is a common air pollutant derved from burring fossel fuel and cigaretts.  According to the EPA:
The primary HAP associated with the oil and natural gas production and natural gas transmission and storage source categories include BTEX and n-hexane. In addition, available information indicates that 2,2,4-trimethylpentane (iso-octane), formaldehyde, acetaldehyde, naphthalene, and ethylene glycol may be present in certain process and emission streams. Carbon disulfide (CS2), carbonyl sulfide (COS), and BTEX may also be present in the tail gas streams from amine treating and sulfur recovery units.
The State of New York identifies 1,2,4-Trimethylbenzene as a "chemical constituent" of "chemical additives proposed to be used in New York for hydraulic fracturing operations at shale wells."

This leaves styrene and dimethyl disulfide without a recognized association with oil & gas production.  Since these two chemicals were detected Alisa Rich and Dr. Sattler assume they must have come from the oil & gas production site in question and build a dispersion model as if they did.  This is why you can't back in air sample contaminant levels taken some distance from the source without first understanding what the normal background level is for the chemicals in question. There is no reason why styrene or dimethyl disulfide would be coming from this site.  Since styrene is a HAP, it would have been identified as chemicals of concern for oil & gas production MACT/GACT compliance under NESHAPS.

So lets say those two chemicals are background contaminants that came from some other process unrelated to oil & gas.  That leaves five remaining.  Both carbon disulfide and carbonyl sulfide (as well as dimethyl disulfide) were identified in the final report and in the lab reports as Tentatively Identified Compound (TICs).

This creates a bit of a problem that was not addressed in the report.  Here is what the TCEQ has to say about TICs:
TICs are observed measurements in the sample for which the gas chromatograph-mass spectrometer (GC/MS) was not specifically calibrated; however, the tentative identification of a compound can be made by comparing the mass spectrum from the environmental sample to a computerized library of mass spectra. The comparison of the sample spectra and that of the library are scored for their similarity to the mass spectrum of a particular TIC and the tentative identification is made based on the most similar spectra. This is a commonly used technique; however, the absolute identity of a TIC is uncertain. Quantifying TICs is also less accurate than for target compounds because the true relative response factor is not known, since the instrument was not calibrated for the TIC. It is important to note these uncertainties when evaluating TICs.
Given the uncertainties in identification and quantification of these compounds and the method used to determine potential 1-hour maximum concentrations, it is not possible to accurately draw conclusions about the potential for adverse health effects.
I understood why, but not to the level needed to discuss it here.  So I asked my professor over at SRPH that happens to know a little bit about analysis and GC/MS.  "It's because of the response factor" he said.  I just nodded my head making a mental note to Google that when I got back to my office.  Here is what I found to be a pretty good explanation of a Response Factor:

The size of a spectral peak is proportional to the amount of the substance that reaches the detector in the GC instrument. No detector responds equally to different compounds. Results using one detector will probably differ from results obtained using another detector. Therefore, comparing analytical results to tabulated experimental data using a different detector does not provide a reliable identification of the specimen.
A “response factor” must be calculated for each substance with a particular detector. A response factor is obtained experimentally by analyzing a known quantity of the substance into the GC instrument and measuring the area of the relevant peak. The experimental conditions (temperature, pressure, carrier gas flow rate) must be identical to those used to analyze the specimen. The response factor equals the area of the spectral peak divided by the weight or volume of the substance injected. If the technician applies the proper technique, of running a standard sample before and after running the specimen, determining a response factor is not necessary.
"Basically," he said.  "Because you did not use a standard that included these TICs, the computer makes a guess as to what chemical the peaks could represent."  He then showed me how this works by letting the computer identify an unknown bunch of peaks on a spectra he had.  The computer spat out a name.  "The lab tech needs to look at the peaks and compare it to the peaks of the compound the computer picked out.  If it's a match, great, but a lot of the time, like this example, the computer gets it wrong."

So basically what he showed me was the analytical equivalent of Damn you Auto Correct.   But they quantified these chemicals I said.  He just stared at me and then shook imaginary dice in his hands and let them fall.  I got the message.  Even if you spent the time comparing the peaks to the chemicals in the library, the lack of a standard means the quantity reported is nothing more than a guess.  Which is why the TCEQ says:
Given the uncertainties in identification and quantification of these compounds and the method used to determine potential 1-hour maximum concentrations, it is not possible to accurately draw conclusions about the potential for adverse health effects.
Well I called the lab and asked them if they physically compared the peaks found to the chemical in the library that the computer picked up.  They said no.  Damn you auto correct!

Now, to be scientific about this - which Alisa Rich should be and Dr. Sattler must be - with this information, we really need to exclude styrene, dimethyl disulfide, carbon disulfide, and carbonyl sulfide from the model.

That leaves only Benzene, Toluene, and 1,2,4-Trimethylbenzene with any reasonable plausibility for being emitted from the oil & gas production site.  Lets look at this from both a comparison to the ESL and AMCV.


Note: Toluene AMCV is for health.  ug/m3 were converted to ppbv using the formula 24.45 x concentration (ug/m3) ÷ molecular weight.  

When compared to the AMCV - which is proper in this case, and any case where air pollution permitting is not the goal -only Benzene and 1,2,4 Trimethylbenzene exceed the Annual AMCV based on the premise that these two chemicals came solely from one source only - the oil & gas production site.

So looking at it under these conditions - straightforward, fair, scientific based - what is the conclusion for the air in the Town of Dish, Texas even if these values were backed in the model?  Remember, those values reported in Table 2 are worst case possibilities.


Next Post: Air Quality in the Barnett Shale - Part 17: Dr. Sattler's Deposition - TCEQ Competency


.

Wednesday, February 16, 2011

Air Quality in the Barnett Shale - Part 15: Dr. Sattler's Deposition - Critique of the Method

In my last post, I discussed a Deposition I received via email regarding Dr. Melanie Sattler's involvement with Alisa Rich of Wolf Eagle Environmental (Cause No. 236-236781-09, December 14, 2010).

I find myself in another sorry-but-I-gotta-call-you-out-on-this-one position.  You see Dr. Sattler is a professor over at UTA.  She's an Engineer.  She also taught and helped Alisa Rich - who then used this association and credentials - to prepare a number of reports that are misleading (see previous posts on this topic).

In the Deposition, Dr. Sattler states:
"I think my work stands up to anybody that has expertise in dispersion modeling. If anybody was criticizing it, they probably didn't have -- well, it wouldn't surprise me to see somebody without a scientific background criticize it, because they probably wouldn't understand it." (Page 158-159)
The use of dispersion modeling to determine an emission rate is fundamentally and categorically an incorrect use of the model - unless - the contaminants being "backed in" to the equation are solely from the source - or - background levels of the contaminants have been factored out.

Here is how Dr. Satller determined the emission rate for the oil & gas production site in the Town of Dish, Texas, that Alisa Rich used to model the potential one-hour and annual exposure for those living in and around that production location:


So Alisa Rich set up seven SUMMA canisters in and around the Oil & Gas production site.  This map is included in the ZIP file titled "Revised Air Study Documents" found here.


From this graphic you might not notice all the potential sources that could be contributing to the seven contaminants reported by Alisa Rich - and supported by Dr. Sattler's work - allowing for the following statement to be made:


See those numbers in columns 2 and 5?  Those are the maximum averaged concentrations the dispersion model calculated could come from the oil & gas production site there in Dish, Texas.  Those values reported in Table 2 are what a human or environmental receptor some distance from the production site could - according to Dr. Sattles' calculations - potentially be exposed to.

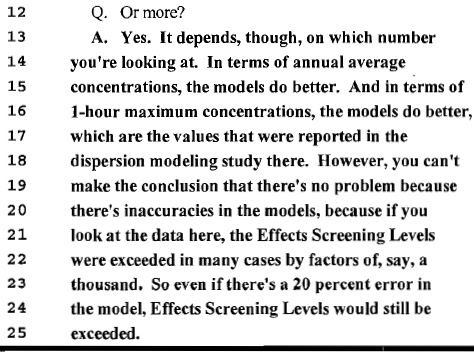
So when Dr. Sattler makes that statement:


She is eluding to the fact that her modeled concentrations are so high that any error inherent in the model's ability to calculate levels of contaminants in and around the source would have no bearing on the model's conclusion that ESLs were exceeded.

This argument would be valid if you knew the actual emission rate of the source and the results obtained were high enough to overcome the percent error inherent in the model.  But in the case of Dish, Texas, her maximum contaminant levels are dependent on calculating an emission rate based on levels found in SUMMA canisters placed in and around the area where the source is located.


Because her basic premise is wrong - that you can back in the contaminant levels that were detected some distance from the source to determine the actual emission rate of the source - all the values presented in Table 2 that come from the model are wrong as well.  There is nothing wrong with the model, it's how she is using it that is wrong.  Why she can't see this, or any of her peers have not questioned her on this, is any one's guess.

There seems to be a clear lack of understanding of just what a dispersion model is capable of telling you.  Yes, she knows how they work and she knows how to report them, but she seems to lack a connection to the number obtained and how it was calculated.  Which is probably why she responded in the Deposition:
Q. When you read through [t]his report, doesn't it give you the impression that, boy, this is really bad, the air out here is just horrible?
A. I don't know.  I don't read it that way.  I look at the numbers. (page 147)
And if all you do is look at the numbers, then you are going to miss the connection to what the numbers must mean. So what do the numbers tell you?  Well based on the dispersion modelling, the air significantly exceeds the short-term and long-term ESL for six compounds.

So what Dr. Sattler accepts as good scientific methodology, is to take the sample results obtained at a distance from the source (the natural gas production area) to figure out what the emission rate coming from this source is.  Once she has this emission rate, the model can now be run like it normally is intended to be run, using all the meteorological data for a year.

Makes perfect sense, as long as you are willing to ignore all the other possible sources of these seven pollutants.  In other words, the assumption - or premise - must be that the levels of contaminants in the SUMMA canisters were solely from the natural gas production site and from no where else. 

For example, by shoving every single bit of Benzene and Toluene detected in the seven canisters back into the model's equation, an emission rate from that source was derived for Benzene and Toluene.  With that emission rate and a years worth of meteorological data, dispersion models could be run and maximum modeled concentrations (see Table 2) derived.

For these two chemicals - Benzene and Toluene - they are everywhere.  They are part of BTEX which is part of fuel, which when burned, enters the atmosphere.  Benzene also comes from smoking cigarettes.  So is it possible that not every bit of Benzene and Toluene detected in the SUMMA canisters was produced by that particular oil & gas production site?  Lets look at a map of the area:


The white rectangle is where the production site is located.  Now go back to the map showing where the sample points were located.  Isn't it possible that these contaminants could have come from other sources?

Dr. Sattler is aware of this as a potential problem:


But the Dish, Texas samples were not collected in the middle of an open field.  They were sampling air from an area where commercial activity took place, people lived, and a major thoroughfare and roads were also nearby.  Isn't it reasonable that some of that Benzene and Toluene may have come from vehicles driving on the nearby streets and FM156?  Or is that just too small of a probability to be considered?

Now if her premise is correct - that outside contaminant sources of contamination can be ignored - would this methodology - the placing of seven SUMMA canisters - work in downtown Houston?  Could you take the analytical results collected over a 24-hour period and back in to the model to derive the emission rate for one of the nearby refineries?  If not, then why is this modeling method acceptable for the Town of Dish, Texas?  You cannot reasonably make the argument for Dish that there is some small probability that maybe a little bit of the compounds came from another source.

To say that all of those seven contaminants came from one source does not even pass a grammar school understanding of how experimentation is supposed to account for bias, noise, and background.  Then, to use that emission rate to build your model whereby you can make bold sweeping statements that ESLs are exceeded by factors of, say, a thousand, is inexcusable.  You see, if the premise is wrong, then the numbers obtained are wrong - or at the very least, inconclusive.  

All models produce numbers.  All models produce numbers that - all things considered - are within a statistically acceptable level of possibility.  But not all the possible numbers produced by a model are plausible.  Intellectual integrity and the scientific method demands one know the difference. 

The numbers produced by Dr. Sattler's model are correct in terms of a calculation.  The premise, however, is wrong, making those dispersion model numbers worthless in looking at short term and long term health effects from this specific natural gas production area.


Next Post: Air Quality in the Barnett Shale - Part 16: Dr. Sattler's Deposition - Those Seven Chemicals


.