Showing posts with label Diamond Princess. Show all posts

Tuesday, July 21, 2020

COVID-19: Down the Rabbit Hole of Death Rate Calculations - Part 6

Note: Written June 26th

Using information from the Diamond Princes, I calculate an Infection Fatality Rate (IFR) of 5.6%. This assumes that the total number of infections can be obtained by knowing the number of confirmed cases and adding 17.9% more to cover the asymptomatic cases that were never tested because,,,well they never knew they were sick.

The issue with this IFR calculation is that it is based on what took place within a population with a median age over 60.

Need more better data!

The WorldoMeters calculates a mortality rate by looking at antibody testing performed in New York and the data out of New York they reported this.
Considering that a large number of cases are asymptomatic (or present with very mild symptoms) and that testing has not been performed on the entire population, only a fraction of the SARS-CoV-2 infected population is detected, confirmed through a laboratory test, and officially reported as a COVID-19 case. The number of actual cases is therefore estimated to be at several multiples above the number of reported cases. The number of deaths also tends to be underestimated, as some patients are not hospitalized and not tested.
Based on the "analyzed the data provided by New York City, the New York State antibody study, and the excess deaths analysis by the CDC. Combining these 3 sources together we can derive the most accurate estimate to date on the mortality rate for COVID-19, as well as the mortality rate by age group and underlying condition."
The survey developed a baseline infection rate by testing 15,103 people at grocery stores and community centers across the state over the preceding two weeks. 
What they found was:
  • 12.3% of the population in the state had COVID-19 antibodies as of May 1, 2020.
  • 19.9% of the population of New York City had COVID-19 antibodies.
Looking at New York City...:
With a population of 8,398,748 people in NYC, this percentage would indicate that 1,671,351 people had been infected with SARS-CoV-2 and had recovered as of May 1 in New York City. The number of confirmed cases reported as of May 1 by New York City was 166,883, more than 10 times less.
What this says to me is that if you were tested and found with antibodies you were past the active infection period and on May 1 you had ether recovered or died. I am going to calculate this a bit different than WorldoMeters because I am going to assume the deaths on May 1 happened 7 days prior. So I am going to look at the deaths reported in NYC on May 9. [I am using 7 days to account for the lag in reporting the deaths, so if we stop on May1 our deaths should - should - be accounted for in the May 9th report]

The IFR is therefore [total deaths] divided by [total recovered plus total deaths].This gives me the pool to pull from, what portion died and what portion survived.


If the New York serum data is correct, we have an IFR of 0.86 to 1.17%. What this could mean in terms of deaths of real people should we continue down the path of waiting for herd immunity as the stopping point looks like this:


If my calculations are correct, and y'all can check my math, if we rely on herd immunity - as some are recommending - we could see 1.97 to 2.68 million of our fellow Americans dead assuming 70% needed to reach herd immunity.

Maybe Boston presents a better estimate...

Down the rabbit hole to Boston we go!

Part 7

COVID-19: Down the Rabbit Hole of Death Rate Calculations - Part 5

Note: Written June 26th

Where are we, as of this date - June 26 - in terms of our outlook for death from COVID-19 in the US?

I can state pretty conclusively using data from all over the world that at least 2 people will die from every 100 confirmed cases of COVID-19. I showed that in my past blog. This calculation, we are told, is the Case Fatality Rate (CFR). The Big Kahuna we need to know is the Infection Fatality Rate (IFR).

The IFR is the number of deaths divided by the number of people who contacted COVID-19, This includes those that are symptomatic and those that are asymptomatic. The conventional wisdom appears to be that more people are symptomatic -and therefore - not tested.

There seems to be supporting evidence for this which I want to look at.
Arons et al. now report in the Journal an outbreak of Covid-19 in a skilled nursing facility in Washington State where a health care provider who was working while symptomatic tested positive for infection with SARS-CoV-2 on March 1, 2020. [New England Journal of Medicine]
Here we have a 'ground zero' situation. The assumption here is that this one worker passed on the infection to those in the nursing home. 
Residents of the facility were then offered two facility-wide point-prevalence screenings for SARS-CoV-2 by real-time reverse-transcriptase polymerase chain reaction (rRT-PCR) of nasopharyngeal swabs on March 13 and March 19–20.
12 days later the residents were tested with the nasal swab looking for the virus - not the antibodies.
Among 76 residents in the point-prevalence surveys, 48 (63%) had positive rRT-PCR results, with 27 (56%) essentially asymptomatic, although symptoms subsequently developed in 24 of these residents (within a median of 4 days) and they were reclassified as presymptomatic.
This is for the residence - which being in a nursing home - would most likely be impacted by a viral infection like COVID-19.
An important finding of this report is that more than half the residents of this skilled nursing facility (27 of 48) who had positive tests were asymptomatic at testing.
 Yet, four days later 24 of those 27 became symptomatic. The reason this is deemed important in this study is they are looking at transmission. I am looking at how many asymptomatic folks would likely never get tested and should be added to the denominator when we do the IFR calculation.

Looking at this data, it would appear that only three out of 76 would never have bothered to get tested as they remained asymptomatic. But these are old people in a nursing home so they are possible much more susceptible to the virus. Still, we can add this to the list in trying to understand what is actually happening in the real world.

Let's look at older people that are not in nursing homes. The Diamond Princess is, I think, the best example of what we might see in the rest of the world. The only exception here is that the passengers were older than the general population and therefore possibly more likely to show symptoms.
On 5 February 2020, in Yokohama, Japan, a cruise ship hosting 3,711 people underwent a 2-week quarantine after a former passenger was found with COVID-19 post-disembarking. As at 20 February, 634 persons on board tested positive for the causative virus. We conducted statistical modelling to derive the delay adjusted asymptomatic proportion of infections, along with the infections’ timeline. The estimated asymptomatic proportion was 17.9% (95% credible interval (CrI): 15.5–20.2%). [Stanford]
Let's assume that for every confirmed case there are at least 17.9% that we do not know about. What we would now see as the IFR - confirmed cases and asymptomatic never tested - would look like this as of today - June 26:


This assumes that the deaths reported as of June 26 came from the reported cases as of June 4 (see previous post on why 22 days). Based on the reported cases we can add 17.9% more cases we suspect are asymptomatic and were never tested.

Still...this is old people data. Let's look at something a bit more representative.

Dig deeper! The rabbit is in there somewhere!

Part 6

COVID-19: Down the Rabbit Hole of Death Rate Calculations - Part 4

Note: Written June 25th

The Infection Fatality Rate - IFR - is the key to the models. And the models are what we use to determine the effort we need to put into our response.

That 'F' is a person...a child, parent, grandparent...a friend. We owe it to them to get the response as close to perfect as we can. "Oops, I was wrong" ain't gonna cut it here.

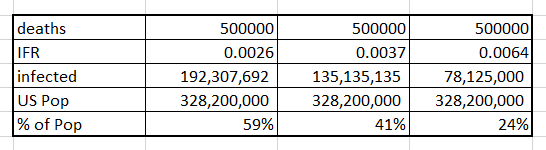
Last post we talked about the German study that said the IFR was 0.37%. We previously talked about the CDC using 0.26%. The other paper NPR referenced puts it at 0.64%.
The CDC's current "best guess" is that — in a scenario without any further social distancing or other efforts to control the spread of the virus — roughly 4 million patients would be hospitalized in the U.S. with COVID-19 and 500,000 would die over the course of the pandemic. [NPR]
To get 500,000 deaths you will need this many infected people at these different IFRs. The lower the IFR the more people who can be infected to get the same number of deaths, 500,000:


We need to know what that IFR is, because the number of infections does not care about the number of deaths, until the number of deaths limits the number of people who can be infected. At some point we reach this thing the call herd immunity where the number of previously infected gets in the way of the virus finding new uninfected people.

We have three things in play here. One, the virus dies out because of weather. Second is we reach herd immunity or third, we develop a vaccine. All of these things can be in play at the same time and that impacts the number who will get COVID-19.

In the US population there is some unknown number of people who COULD get COVID-19. In the absence of anything else coming into play, we can reasonably make a guess that at some percent of the population we will have reached herd immunity and the virus will go "poof" and "be on its way out."

 According to the Mayo Clinic:
Even if infection with the COVID-19 virus creates long-lasting immunity, a large number of people would have to become infected to reach the herd immunity threshold. Experts estimate that in the U.S., 70% of the population — more than 200 million people — would have to recover from COVID-19 to halt the epidemic.
Let's go with that number of 200,000,000 people needing to get infected in the US for herd immunity to be viable:


My concern is that the ACTUAL number for the IFR is at least 1%. If I am correct, then to reach herd immunity at least 2,000,000 Americans will die. Now that number is if we do nothing but rely on herd immunity. If you look at compliance with social distancing and mask wearing, we are probably about 50% compliant based on what I see day-to-day.

Diving deeper into the rabbit hole of death rate, let's look at some numbers.

First, let's agree on some time frames. From the CDC:
  • Time from exposure to symptoms onset: 6 days on average.
  • Time to seek care as an out patient: 2 days average.
...and for Mr. Death:


Let's do death math!


We need to make some assumptions here. The numbers we get are not perfect, but with so much data things should wash out and be close to what we need to say confidently this is what we are seeing.

We need to assume that the positive tests we had on May 1 either recovered or died. And if they died, we knew about those deaths by May 21.

Now you may be saying, but Bowman, you are calculating the Case Fatality Rate with this! Yes...but I want to figure out the Infection Fatality Rate by understanding how many untested people we have that were also infected with COVID-19 by using these known cases.

I have three ways to get an estimate of that number that I think are both valid and "good enough" to get an idea. We can look at the data from the Diamond Princess cruise ship, Testing done in New York looking for antibodies, and testing in Boston looking for antibodies.

These assumptions above will get me to a number of deaths from COVID-19 that I need to calculate the IFR. Once I know the number of asymptomatic cases that have not received a positive case result I should be able to get a ratio of tested to the total infected. So if you say we had 22,258 new cases on June 2, we would have some number more of asymptomatic people that were not tested.

That ratio, I think, should remain constant only changing when we test more asymptomatic people and catch them with the virus. As an example, if 10% of the population had the antibodies with a population of 100,000, then 10,000 people were infected. If on that date we go two days into the future the accumulated number of those testing positive will give us a ratio. So if  one thousand tested positive, you could say that for every one positive test there are nine other asymptomatic.

Now whether the pool should be asymptomatic plus confirmed or assume that the 10% includes all of those who were infected is open for debate. I can run the numbers both ways to get an idea.

If this ratio holds over time, then I can get an estimate of how soon we should hit herd immunity. The problem here is that I don't know how many COVID-19 tests looking for the virus are now finding those asymptomatic that would not have been tested when this data was collected in New York and Boston.

I suspect that since we are doing more testing we are catching the asymptomatic that went for testing because they knew they were exposed. If that's the case, then later on the cases reported will now be closer to the all infected and my ratio will not be valid.

So here we go deeper, deeper, and deeper into the rabbit hole of death rates by heading over to Boston.

Part 5